
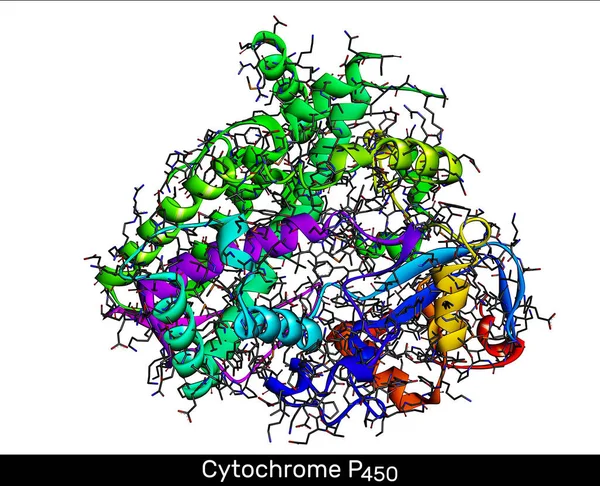
Stock image Cytochrome P450
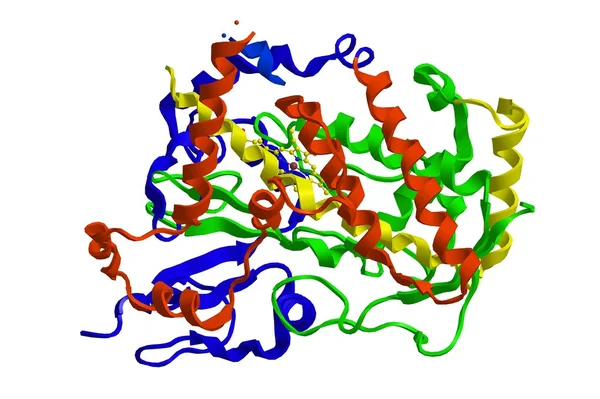

Diagram Of Drug Metabolism Inducer Process - Effect On CYP450 Enzymes Synthesis, Drug Metabolism, Half Life, Plasma Concentration And Pharmacological Effect. Simple Flow Chart Illustration.
Vector, 5.45MB, 2000 × 2000 eps

Diagram Of Drug Metabolism Inducer Process - Effect On CYP450 Enzymes Synthesis, Drug Metabolism, Half Life, Plasma Concentration And Pharmacological Effect. Simple Flow Chart Illustration.
Vector, 5.45MB, 2000 × 2000 eps

Diagram Of Drug Metabolism Inhibitor Process - Effect On CYP450 Enzymes Synthesis, Drug Metabolism, Half Life, Plasma Concentration And Pharmacological Effect. Simple Flow Chart Illustration.
Vector, 5.44MB, 2000 × 2000 eps

Diagram Of Drug Metabolism Inhibitor Process - Effect On CYP450 Enzymes Synthesis, Drug Metabolism, Half Life, Plasma Concentration And Pharmacological Effect. Simple Flow Chart Illustration.
Vector, 5.44MB, 2000 × 2000 eps

Schematic Diagram Showing Phases I, II Drug Metabolism And Excertion - Via CYP45- And Transferase Reactions. Pharmacological Process Illustration.
Vector, 5.52MB, 2000 × 2000 eps

Schematic Diagram Showing Phases I, II Drug Metabolism And Excertion - Via CYP45- And Transferase Reactions. Pharmacological Process Illustration.
Vector, 5.54MB, 2000 × 2000 eps
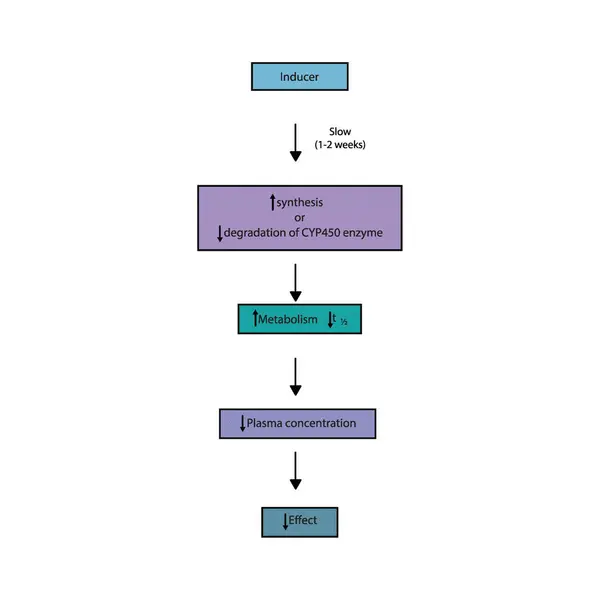
Diagram Of Drug Metabolism Inducer Process - Effect On CYP450 Enzymes Synthesis, Drug Metabolism, Half Life, Plasma Concentration And Pharmacological Effect. Simple Flow Chart Illustration.
Vector, 5.45MB, 2000 × 2000 eps
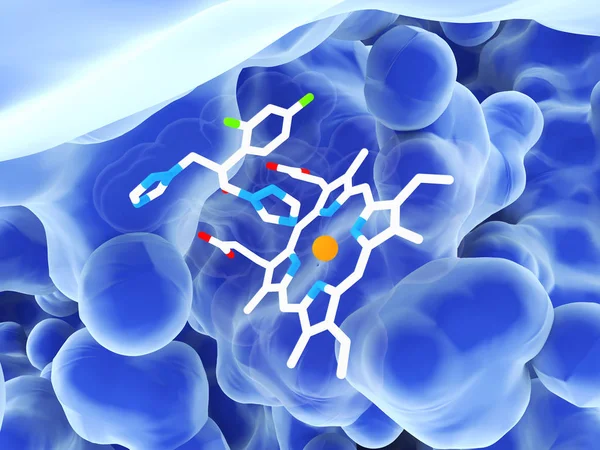
Fluconazole Interacting With A Heme Group In The Active Site Of The Lanosterol 14 Alpha-demethylase
Image, 5.65MB, 8000 × 6000 jpg
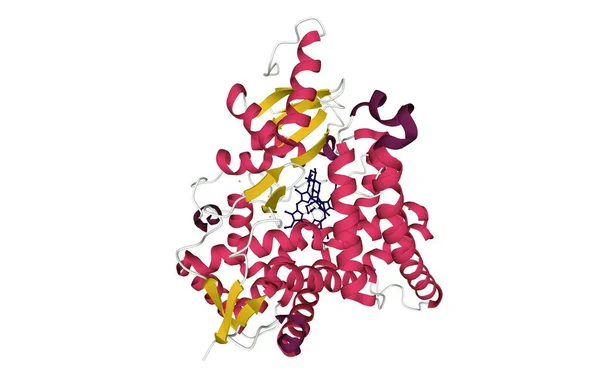
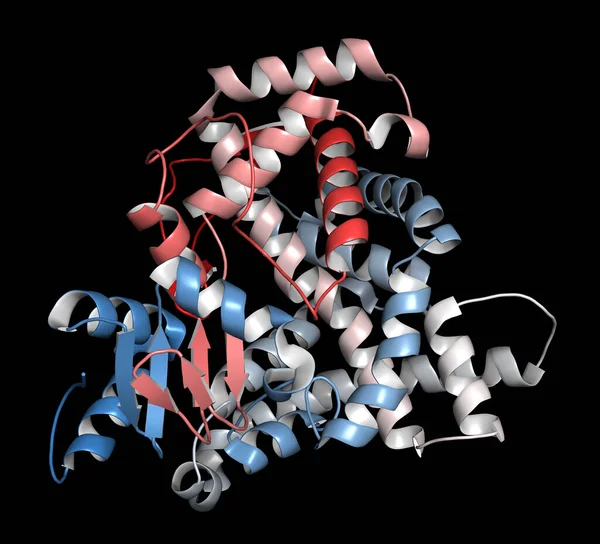
Human Placental Aromatase Cytochrome P450 (CYP19A1) Complexed With Testosterone, 3D Cartoon Model With Colored Elements Of The Secondary Structure, White Background
Image, 2.33MB, 6258 × 3993 jpg

3D Image Of Naringin Skeletal Formula - Molecular Chemical Structure Of Flavanone-7-O-glycoside Isolated On White Background
Image, 5.26MB, 8586 × 6072 jpg

Schematic Diagram Showing Phases I, II Drug Metabolism And Excertion - Via CYP45- And Transferase Reactions. Pharmacological Process Illustration.
Vector, 5.53MB, 2000 × 2000 eps

Diagram Of Drug Metabolism Inducer Process - Effect On CYP450 Enzymes Synthesis, Drug Metabolism, Half Life, Plasma Concentration And Pharmacological Effect. Simple Flow Chart Illustration.
Vector, 5.44MB, 2000 × 2000 eps
Cytochrome P450 Molecule. CYP 3A4 Is The Most Promiscuous Of The Human CYP Enzymes. Molecular Model. 3D Rendering. Illustration
Image, 11.45MB, 7008 × 5680 jpg

Diagram Of Phase I And II Drug Metabolism Of Phenobarbital - Skeletal Structure Of Biotransformation Reaction.
Vector, 5.5MB, 2000 × 2000 eps

Diagram Of Phase I And II Drug Metabolism Of Phenobarbital - Skeletal Structure Of Biotransformation Reaction.
Vector, 5.5MB, 2000 × 2000 eps

Diagram Of Drug Metabolism Inhibitor Process - Effect On CYP450 Enzymes Synthesis, Drug Metabolism, Half Life, Plasma Concentration And Pharmacological Effect. Simple Flow Chart Illustration.
Vector, 5.44MB, 2000 × 2000 eps

Diagram Of Drug Metabolism Inhibitor Process - Effect On CYP450 Enzymes Synthesis, Drug Metabolism, Half Life, Plasma Concentration And Pharmacological Effect. Simple Flow Chart Illustration.
Vector, 5.44MB, 2000 × 2000 eps

Schematic Diagram Showing Phases I, II Drug Metabolism And Excertion - Via CYP45- And Transferase Reactions. Pharmacological Process Illustration.
Vector, 5.53MB, 2000 × 2000 eps

Diagram Of Phase I And II Drug Metabolism Of Phenobarbital - Skeletal Structure Of Biotransformation Reaction.
Vector, 5.47MB, 2000 × 2000 eps

Schematic Diagram Showing Phases I, II Drug Metabolism And Excertion - Via CYP45- And Transferase Reactions. Pharmacological Process Illustration.
Vector, 5.52MB, 2000 × 2000 eps

Diagram Of Phase I And II Drug Metabolism Of Phenobarbital - Skeletal Structure Of Biotransformation Reaction.
Vector, 5.47MB, 2000 × 2000 eps

Diagram Of Phase I And II Drug Metabolism Of Phenobarbital - Skeletal Structure Of Biotransformation Reaction.
Vector, 5.5MB, 2000 × 2000 eps

Diagram Of Drug Metabolism Inhibitor Process - Effect On CYP450 Enzymes Synthesis, Drug Metabolism, Half Life, Plasma Concentration And Pharmacological Effect. Simple Flow Chart Illustration.
Vector, 5.44MB, 2000 × 2000 eps

Fluconazole, Molecule. It Is Triazole Antifungal Medication Used To Treat Fungal Infections, Candidiasis. Structural Chemical Formula, Molecule Model. Sheet Of Paper In A Cage. Vector Illustration
Vector, 5.43MB, 5916 × 4226 eps

Fluconazole, Molecule. It Is Triazole Antifungal Medication Used To Treat Fungal Infections, Candidiasis. Structural Chemical Formula And Molecule Model. Vector Illustration
Vector, 5.29MB, 5735 × 4359 eps

Aromatase (estrogen Synthase) Enzyme. Protein Responsible For The Key Step In The Synthesis Of Estrogens. 3D Illustration.
Image, 10.14MB, 8000 × 7151 jpg
Aromatase (estrogen Synthase) Enzyme. Protein Responsible For The Key Step In The Synthesis Of Estrogens. 3D Illustration. Cartoon Representation.
Image, 7.69MB, 8000 × 7263 jpg
Page 1 >> Next