photo free
Home Images Vectors Videos

Stock image Dashboard Data page 2

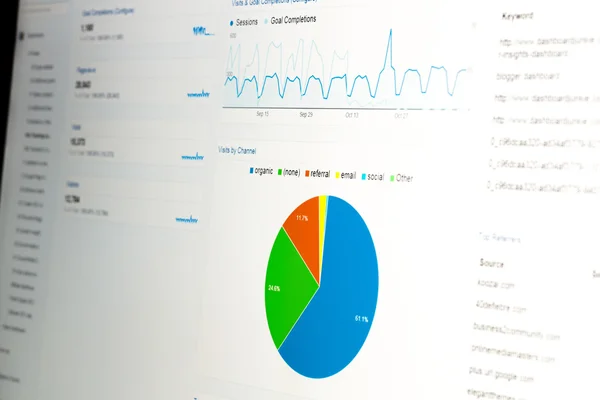
stock image Close-up of web analytics dashboard

Close-up Of Web Analytics Dashboard

Image, 6.24MB, 5760 × 3840 jpg
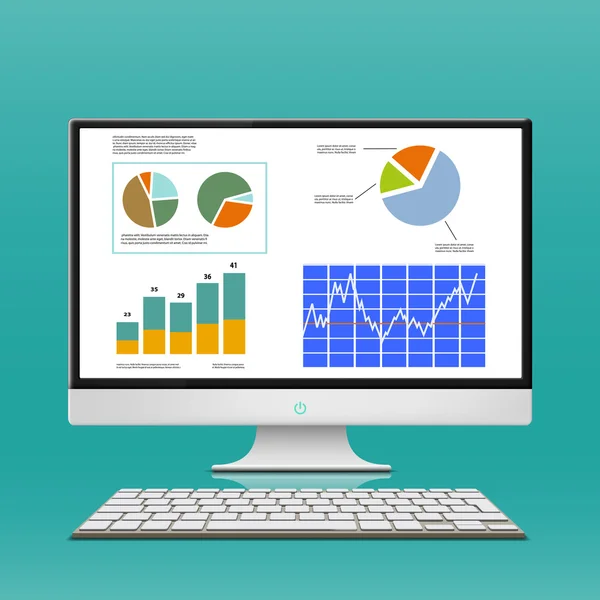
stock vector Simple infographic dashboard template

Simple Infographic Dashboard Template

Vector, 6.71MB, 3900 × 3984 eps
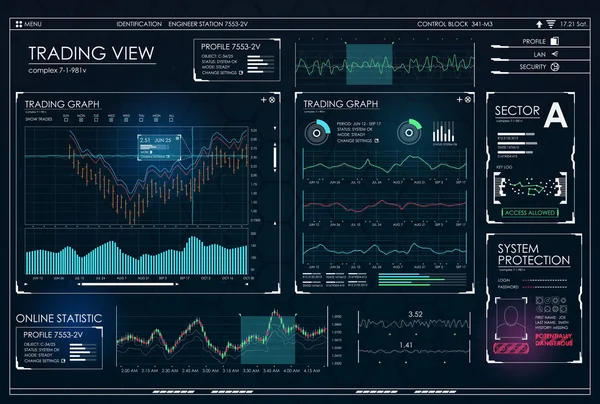
stock vector Cyberspace Virtual reality in HUD, GUI style

Cyberspace Virtual Reality In HUD, GUI Style

Vector, 6.03MB, 4135 × 1752 eps
stock vector Infographic dashboard template with flat design graphs and charts. Information

Infographic Dashboard Template With Flat Design Graphs And Charts. Information

Vector, 3.07MB, 6132 × 4168 eps
stock image work hard Data Analytics Statistics Information Business Technol

Work Hard Data Analytics Statistics Information Business Technol

Image, 6.83MB, 6000 × 4000 jpg
stock image KPI Business Market Dashboard Data Technology On Laptop

KPI Business Market Dashboard Data Technology On Laptop

Image, 0MB, 9504 × 6336 jpg
stock vector Abstract future, concept vector futuristic blue virtual graphic touch user interface HUD. For web, site, mobile applications isolated on black background, techno, online design, business, gui, ui.

Abstract Future, Concept Vector Futuristic Blue Virtual Graphic Touch User Interface HUD. For Web, Site, Mobile Applications Isolated On Black Background, Techno, Online Design, Business, Gui, Ui.

Vector, 3.17MB, 7001 × 5251 eps
stock image KPI Dashboard Data Analytics On Business Laptop

KPI Dashboard Data Analytics On Business Laptop

Image, 20.44MB, 9340 × 6227 jpg
stock vector Line Hosting Icons

Line Hosting Icons

Vector, 0.81MB, 5000 × 4138 eps
stock vector Big data concept. Vector illustration of dashboard.

Big Data Concept. Vector Illustration Of Dashboard.

Vector, 1.22MB, 7016 × 4961 eps
stock image KPI Dashboard Data Analytics On Business Laptop

KPI Dashboard Data Analytics On Business Laptop

Image, 17.56MB, 15070 × 5190 jpg
stock image Multiracial analyst team use BI Fintech software to analyze financial data on meeting table. Financial dashboard data display on laptop screen with analyzed chart for marketing indication. Concord

Multiracial Analyst Team Use BI Fintech Software To Analyze Financial Data On Meeting Table. Financial Dashboard Data Display On Laptop Screen With Analyzed Chart For Marketing Indication. Concord

Image, 2.38MB, 3240 × 2160 jpg
stock image Multiracial analyst team use BI dashboard data to analyze financial report on meeting table. Group of diverse business people utilize data analysis by FIntech for business marketing decision. Concord

Multiracial Analyst Team Use BI Dashboard Data To Analyze Financial Report On Meeting Table. Group Of Diverse Business People Utilize Data Analysis By FIntech For Business Marketing Decision. Concord

Image, 7.44MB, 5168 × 3448 jpg
stock image Multiracial analyst team use BI Fintech software to analyze financial data on meeting table. Financial dashboard data display on laptop screen with analyzed chart for marketing indication. Concord

Multiracial Analyst Team Use BI Fintech Software To Analyze Financial Data On Meeting Table. Financial Dashboard Data Display On Laptop Screen With Analyzed Chart For Marketing Indication. Concord

Image, 14.54MB, 7952 × 4873 jpg
stock image Multiracial analyst team use BI dashboard data to analyze financial report on meeting table. Group of diverse business people utilize data analysis by FIntech for business marketing decision. Concord

Multiracial Analyst Team Use BI Dashboard Data To Analyze Financial Report On Meeting Table. Group Of Diverse Business People Utilize Data Analysis By FIntech For Business Marketing Decision. Concord

Image, 6.48MB, 5168 × 3448 jpg
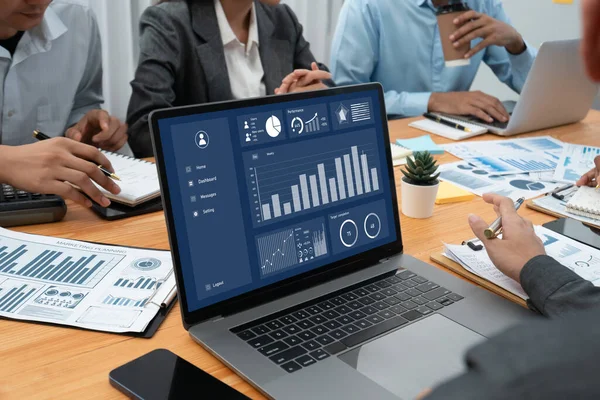
stock image Multiracial analyst team use BI Fintech software to analyze financial data on meeting table. Financial dashboard data display on laptop screen with analyzed chart for marketing indication. Concord

Multiracial Analyst Team Use BI Fintech Software To Analyze Financial Data On Meeting Table. Financial Dashboard Data Display On Laptop Screen With Analyzed Chart For Marketing Indication. Concord

Image, 6MB, 5168 × 3448 jpg
stock image Multiracial analyst team use BI Fintech software to analyze financial data on meeting table. Financial dashboard data display on laptop screen with analyzed chart for marketing indication. Concord

Multiracial Analyst Team Use BI Fintech Software To Analyze Financial Data On Meeting Table. Financial Dashboard Data Display On Laptop Screen With Analyzed Chart For Marketing Indication. Concord

Image, 6.66MB, 5168 × 3448 jpg
stock image Multiracial analyst team use BI Fintech software to analyze financial data on meeting table. Financial dashboard data display on laptop screen with analyzed chart for marketing indication. Concord

Multiracial Analyst Team Use BI Fintech Software To Analyze Financial Data On Meeting Table. Financial Dashboard Data Display On Laptop Screen With Analyzed Chart For Marketing Indication. Concord

Image, 2.67MB, 3240 × 2160 jpg
stock image Multiracial analyst team use BI Fintech software to analyze financial data on meeting table. Financial dashboard data display on laptop screen with analyzed chart for marketing indication. Concord

Multiracial Analyst Team Use BI Fintech Software To Analyze Financial Data On Meeting Table. Financial Dashboard Data Display On Laptop Screen With Analyzed Chart For Marketing Indication. Concord

Image, 13.5MB, 7951 × 4768 jpg
stock image Top view multiracial analyst team use BI dashboard display on laptop screen, analyzing financial data for strategic decision. Fintech analyzes marketing indicators. Concord

Top View Multiracial Analyst Team Use BI Dashboard Display On Laptop Screen, Analyzing Financial Data For Strategic Decision. Fintech Analyzes Marketing Indicators. Concord

Image, 2.29MB, 3111 × 1945 jpg
stock image Multiracial analyst team use BI dashboard data to analyze financial report on meeting table. Group of diverse business people utilize data analysis by FIntech for success business marketing. Concord

Multiracial Analyst Team Use BI Dashboard Data To Analyze Financial Report On Meeting Table. Group Of Diverse Business People Utilize Data Analysis By FIntech For Success Business Marketing. Concord

Image, 16.91MB, 7952 × 5304 jpg
stock image Top view multiracial analyst team use BI dashboard display on laptop screen, analyzing financial data for strategic decision. Fintech analyzes marketing indicators. Concord

Top View Multiracial Analyst Team Use BI Dashboard Display On Laptop Screen, Analyzing Financial Data For Strategic Decision. Fintech Analyzes Marketing Indicators. Concord

Image, 3.83MB, 3207 × 2182 jpg
stock image Multiracial analyst team use BI dashboard data to analyze financial report on meeting table. Group of diverse business people utilize data analysis by FIntech for success business marketing. Concord

Multiracial Analyst Team Use BI Dashboard Data To Analyze Financial Report On Meeting Table. Group Of Diverse Business People Utilize Data Analysis By FIntech For Success Business Marketing. Concord

Image, 2.86MB, 3240 × 2160 jpg
stock image Multiracial analyst team use BI dashboard data to analyze financial report on meeting table. Group of diverse business people utilize data analysis by FIntech for success business marketing. Concord

Multiracial Analyst Team Use BI Dashboard Data To Analyze Financial Report On Meeting Table. Group Of Diverse Business People Utilize Data Analysis By FIntech For Success Business Marketing. Concord

Image, 12.55MB, 5304 × 7494 jpg
stock image Multiracial analyst team use BI Fintech software to analyze financial data on meeting table. Financial dashboard data display on laptop screen with analyzed chart for marketing indication. Concord

Multiracial Analyst Team Use BI Fintech Software To Analyze Financial Data On Meeting Table. Financial Dashboard Data Display On Laptop Screen With Analyzed Chart For Marketing Indication. Concord

Image, 2.71MB, 3240 × 2160 jpg
stock image Multiracial analyst team use BI Fintech software to analyze financial data on meeting table. Financial dashboard data display on laptop screen with analyzed chart for marketing indication. Concord

Multiracial Analyst Team Use BI Fintech Software To Analyze Financial Data On Meeting Table. Financial Dashboard Data Display On Laptop Screen With Analyzed Chart For Marketing Indication. Concord

Image, 12.85MB, 7952 × 5304 jpg
stock image Multiracial analyst team use BI Fintech software to analyze financial data on meeting table. Financial dashboard data display on laptop screen with analyzed chart for marketing indication. Concord

Multiracial Analyst Team Use BI Fintech Software To Analyze Financial Data On Meeting Table. Financial Dashboard Data Display On Laptop Screen With Analyzed Chart For Marketing Indication. Concord

Image, 6.02MB, 5168 × 3448 jpg
stock image Multiracial analyst team use BI dashboard data to analyze financial report on meeting table. Group of diverse business people utilize data analysis by FIntech for success business marketing. Concord

Multiracial Analyst Team Use BI Dashboard Data To Analyze Financial Report On Meeting Table. Group Of Diverse Business People Utilize Data Analysis By FIntech For Success Business Marketing. Concord

Image, 6.97MB, 5168 × 3448 jpg
stock image Top view multiracial analyst team use BI dashboard display on laptop screen, analyzing financial data for strategic decision. Fintech analyzes marketing indicators. Concord

Top View Multiracial Analyst Team Use BI Dashboard Display On Laptop Screen, Analyzing Financial Data For Strategic Decision. Fintech Analyzes Marketing Indicators. Concord

Image, 3.94MB, 3240 × 2160 jpg
stock image Multiracial analyst team use BI dashboard data to analyze financial report on meeting table. Group of diverse business people utilize data analysis by FIntech for business marketing decision. Concord

Multiracial Analyst Team Use BI Dashboard Data To Analyze Financial Report On Meeting Table. Group Of Diverse Business People Utilize Data Analysis By FIntech For Business Marketing Decision. Concord

Image, 17.65MB, 7952 × 5304 jpg
stock image Multiracial analyst team use BI Fintech software to analyze financial data on meeting table. Financial dashboard data display on laptop screen with analyzed chart for marketing indication. Concord

Multiracial Analyst Team Use BI Fintech Software To Analyze Financial Data On Meeting Table. Financial Dashboard Data Display On Laptop Screen With Analyzed Chart For Marketing Indication. Concord

Image, 14.13MB, 7952 × 5304 jpg
stock image Multiracial analyst team use BI Fintech software to analyze financial data on meeting table. Financial dashboard data display on laptop screen with analyzed chart for marketing indication. Concord

Multiracial Analyst Team Use BI Fintech Software To Analyze Financial Data On Meeting Table. Financial Dashboard Data Display On Laptop Screen With Analyzed Chart For Marketing Indication. Concord

Image, 3MB, 3240 × 2160 jpg
stock image Multiracial analyst team use BI dashboard data to analyze financial report on meeting table. Group of diverse business people utilize data analysis by FIntech for success business marketing. Concord

Multiracial Analyst Team Use BI Dashboard Data To Analyze Financial Report On Meeting Table. Group Of Diverse Business People Utilize Data Analysis By FIntech For Success Business Marketing. Concord

Image, 1.86MB, 2474 × 1650 jpg
stock image Multiracial analyst team use BI dashboard data to analyze financial report on meeting table. Group of diverse business people utilize data analysis by FIntech for success business marketing. Concord

Multiracial Analyst Team Use BI Dashboard Data To Analyze Financial Report On Meeting Table. Group Of Diverse Business People Utilize Data Analysis By FIntech For Success Business Marketing. Concord

Image, 12.53MB, 7952 × 5304 jpg
stock image Multiracial analyst team use BI dashboard data to analyze financial report on meeting table. Group of diverse business people utilize data analysis by FIntech for success business marketing. Concord

Multiracial Analyst Team Use BI Dashboard Data To Analyze Financial Report On Meeting Table. Group Of Diverse Business People Utilize Data Analysis By FIntech For Success Business Marketing. Concord

Image, 13.27MB, 5304 × 7952 jpg
stock image Multiracial analyst team use BI Fintech software to analyze financial data on meeting table. Financial dashboard data display on laptop screen with analyzed chart for marketing indication. Concord

Multiracial Analyst Team Use BI Fintech Software To Analyze Financial Data On Meeting Table. Financial Dashboard Data Display On Laptop Screen With Analyzed Chart For Marketing Indication. Concord

Image, 15.21MB, 7952 × 5304 jpg
stock image Multiracial analyst team use BI dashboard data to analyze financial report on meeting table. Group of diverse business people utilize data analysis by FIntech for business marketing decision. Concord

Multiracial Analyst Team Use BI Dashboard Data To Analyze Financial Report On Meeting Table. Group Of Diverse Business People Utilize Data Analysis By FIntech For Business Marketing Decision. Concord

Image, 13.63MB, 7446 × 4787 jpg
stock image Multiracial analyst team use BI dashboard data to analyze financial report on meeting table. Group of diverse business people utilize data analysis by FIntech for success business marketing. Concord

Multiracial Analyst Team Use BI Dashboard Data To Analyze Financial Report On Meeting Table. Group Of Diverse Business People Utilize Data Analysis By FIntech For Success Business Marketing. Concord

Image, 2.85MB, 3431 × 2039 jpg
stock image Top view multiracial analyst team use BI dashboard display on laptop screen, analyzing financial data for strategic decision. Fintech analyzes marketing indicators. Concord

Top View Multiracial Analyst Team Use BI Dashboard Display On Laptop Screen, Analyzing Financial Data For Strategic Decision. Fintech Analyzes Marketing Indicators. Concord

Image, 3.79MB, 3306 × 2116 jpg
stock image Multiracial analyst team use BI Fintech software to analyze financial data on meeting table. Financial dashboard data display on laptop screen with analyzed chart for marketing indication. Concord

Multiracial Analyst Team Use BI Fintech Software To Analyze Financial Data On Meeting Table. Financial Dashboard Data Display On Laptop Screen With Analyzed Chart For Marketing Indication. Concord

Image, 3.02MB, 3240 × 2160 jpg
stock image Multiracial analyst team use BI Fintech software to analyze financial data on meeting. Top view finance dashboard data display on laptop screen with analyzed chart for marketing indication. Concord

Multiracial Analyst Team Use BI Fintech Software To Analyze Financial Data On Meeting. Top View Finance Dashboard Data Display On Laptop Screen With Analyzed Chart For Marketing Indication. Concord

Image, 3.78MB, 3305 × 2117 jpg
stock image Panorama top view multiracial analyst team use BI dashboard display on laptop screen, analyzing financial data for strategic decision. Fintech analyzes marketing indicators. Concord

Panorama Top View Multiracial Analyst Team Use BI Dashboard Display On Laptop Screen, Analyzing Financial Data For Strategic Decision. Fintech Analyzes Marketing Indicators. Concord

Image, 14.72MB, 7491 × 4590 jpg
stock image Multiracial analyst team use BI dashboard data to analyze financial report on meeting table. Group of diverse business people utilize data analysis by FIntech for business marketing decision. Concord

Multiracial Analyst Team Use BI Dashboard Data To Analyze Financial Report On Meeting Table. Group Of Diverse Business People Utilize Data Analysis By FIntech For Business Marketing Decision. Concord

Image, 7.29MB, 5168 × 3448 jpg

stock vector Financial charts and graphs on computer monitor

Financial Charts And Graphs On Computer Monitor

Vector, 3.07MB, 5000 × 5000 eps
stock vector Futuristic user interface HUD

Futuristic User Interface HUD

Vector, 3.3MB, 5000 × 3368 eps
stock vector Abstract future, concept vector futuristic blue virtual graphic touch user interface HUD. For web, site, mobile applications isolated on black background, techno, online design, business, gui, ui.

Abstract Future, Concept Vector Futuristic Blue Virtual Graphic Touch User Interface HUD. For Web, Site, Mobile Applications Isolated On Black Background, Techno, Online Design, Business, Gui, Ui.

Vector, 11.19MB, 7000 × 6125 eps
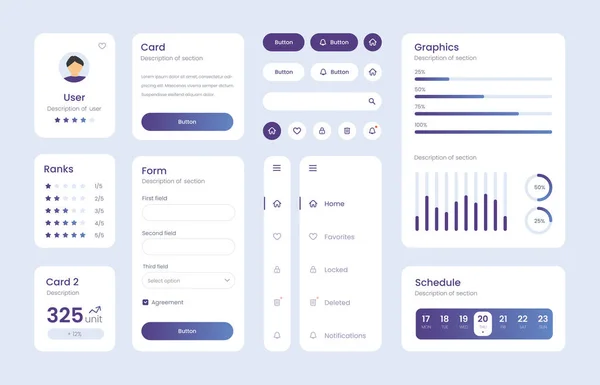
stock vector Design Elements - Analytics, statistic report - vectors set 2

Design Elements - Analytics, Statistic Report - Vectors Set 2

Vector, 0.09MB, 5000 × 5000 ai
stock vector Flat design Admin Dashboard UI mobile app

Flat Design Admin Dashboard UI Mobile App

Vector, 5.51MB, 6000 × 4499 eps
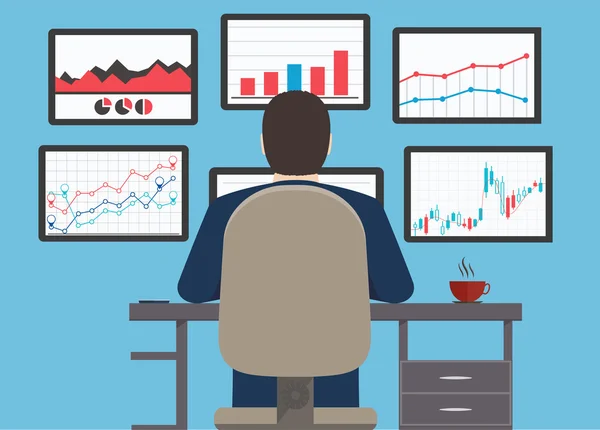
stock vector Workstation, web analytics information and development website s

Workstation, Web Analytics Information And Development Website S

Vector, 0.74MB, 5127 × 3678 eps
stock vector Light Collection of gradient ui ux elements. Ux dashboard user panel template. User interface, experience. UI elements to book the app.

Light Collection Of Gradient Ui Ux Elements. Ux Dashboard User Panel Template. User Interface, Experience. UI Elements To Book The App.

Vector, 5.87MB, 9391 × 6038 eps
Previous << Page 2 >> Next