
Stock image Depolarization Potential
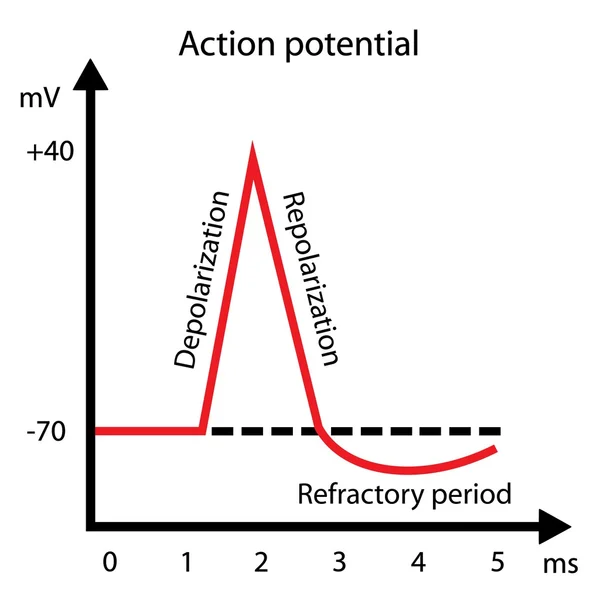

The QT Interval Of ECG Is From The Beginning Of QRS Wave To The End Of T Wave, Representing The Total Time Of Ventricular Depolarization And Repolarization.
Image, 8.09MB, 10000 × 10950 jpg

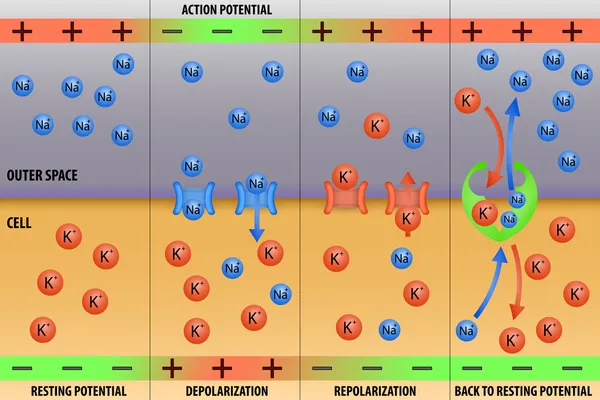
Depolarization: Phospholipid Membrane With NA + And K + Ion Channels.
Image, 2.27MB, 6600 × 5452 jpg

Depolarization: Phospholipid Membrane With NA + And K + Ion Channels.
Image, 2.35MB, 6600 × 5452 jpg

R Wave Greater Than S Wave Is Judged To Be Positive; R Smaller Than S Is Judged To Be Negative; R Equal To S Amplitude Is Judged To Be Equipotential.
Image, 7.5MB, 10000 × 5119 jpg
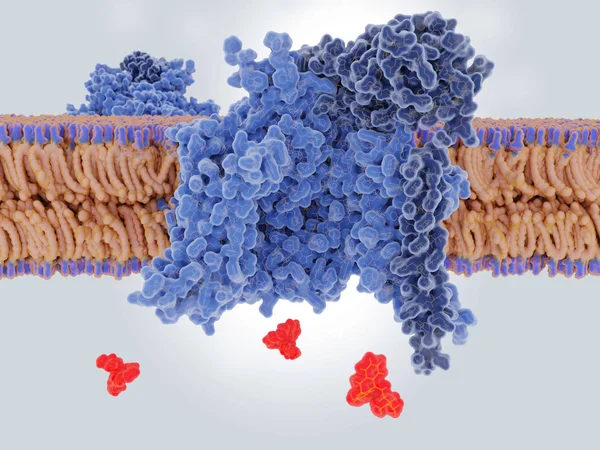
Antidepressive Drug (amitriptilyne) Binding To And Blocking A Sodium Channel
Image, 8.37MB, 8000 × 6000 jpg

Propagation And Conduction Of Nerve Impulse Infographic Diagram Including Polarization Resting Potential Depolarization Action Re-polarization Neurology Biology Physiology Science Education Vector
Vector, 1.05MB, 2718 × 2222 eps

Passage Of The Nerve Impulse Through The Axon Infographic Diagram Including Polarization Resting Potential Depolarization Action Re-polarization Neurology Biology Physiology Science Education Vector
Vector, 1.14MB, 2124 × 2876 eps
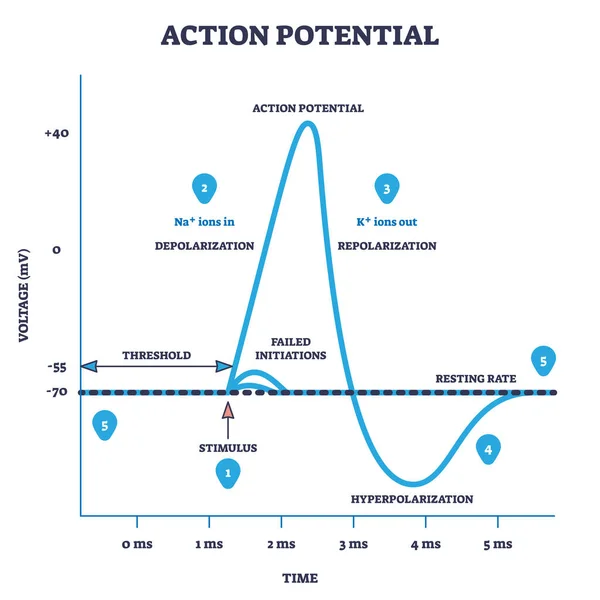
Action Potential And Neuron Membrane Spike After Stimulus Outline Diagram. Labeled Educational Scheme With Threshold, Depolarization, Hyperpolarization And Repolarization On Axis Vector Illustration.
Vector, 5.6MB, 4200 × 4200 eps
APM _ Actions Per Minute, Letters And Icons, And Vector Illustration.
Vector, 1.24MB, 3402 × 3402 eps
Page 1 >> Next