photo free
Home Images Vectors Videos

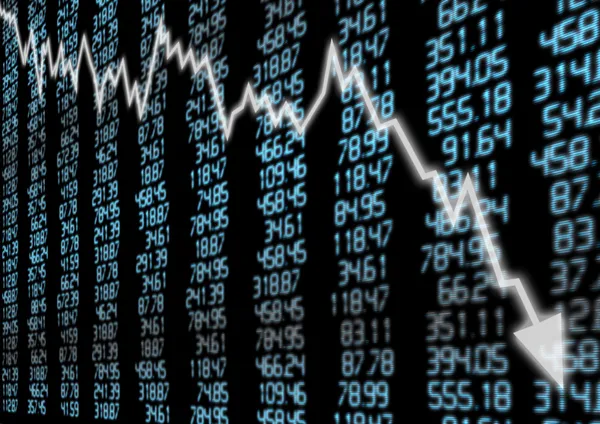
Stock image Economy Downturn

stock image white blocks with recession word on office desk

White Blocks With Recession Word On Office Desk

Image, 6.5MB, 7360 × 4912 jpg
stock image Chart with red down arrow on abstract background. Falling growth in business.

Chart With Red Down Arrow On Abstract Background. Falling Growth In Business.

Image, 1.7MB, 9000 × 3214 jpg
stock image Cut cost concept

Cut Cost Concept

Image, 15.23MB, 6488 × 4330 jpg
stock image Cost control concept

Cost Control Concept

Image, 12.99MB, 6130 × 4091 jpg
stock image Cut cost concept

Cut Cost Concept

Image, 11.17MB, 6546 × 4369 jpg
stock image Cut cost concept

Cut Cost Concept

Image, 11.88MB, 6400 × 4271 jpg
stock image Cost cutting concept using scissor

Cost Cutting Concept Using Scissor

Image, 10.01MB, 6650 × 4438 jpg
stock image Stock exchange background. Abstract finance wallpaper. Blurred Traders Office.

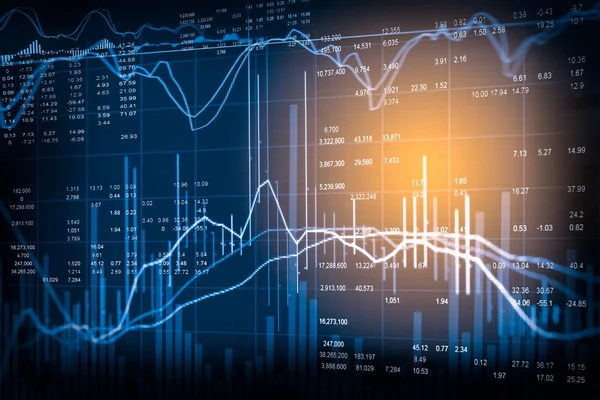
Stock Exchange Background. Abstract Finance Wallpaper. Blurred Traders Office.

Image, 0.64MB, 4500 × 3000 jpg
stock vector Isometric global finance crisis concept. Global economy crash. Unemployment, jobless and employee job reduction metaphor.

Isometric Global Finance Crisis Concept. Global Economy Crash. Unemployment, Jobless And Employee Job Reduction Metaphor.

Vector, 2.3MB, 6000 × 2687 eps
stock image Arrow report loss statistics

Arrow Report Loss Statistics

Image, 1.16MB, 3097 × 2324 jpg
stock vector Business men and woman financial collapse

Business Men And Woman Financial Collapse

Vector, 4.87MB, 6000 × 4000 eps
stock image Economy and health care as an economic pandemic fear and coronavirus fears or virus Outbreak and Stock market selling as a stock financial recession concept with 3D illustration elements.

Economy And Health Care As An Economic Pandemic Fear And Coronavirus Fears Or Virus Outbreak And Stock Market Selling As A Stock Financial Recession Concept With 3D Illustration Elements.

Image, 21.72MB, 7234 × 4000 jpg
stock vector Businessman sit on arrow stock market crash

Businessman Sit On Arrow Stock Market Crash

Vector, 1.54MB, 5906 × 4724 eps
stock image Closeup of a stock market broker working with graphs on digital tablet at office. Rear view of stock agent reading bad report and graph. Back view of multiethnic businessman analyzing fall sales.

Closeup Of A Stock Market Broker Working With Graphs On Digital Tablet At Office. Rear View Of Stock Agent Reading Bad Report And Graph. Back View Of Multiethnic Businessman Analyzing Fall Sales.

Image, 15.13MB, 5841 × 3879 jpg
stock image Lifesaver

Lifesaver

Image, 8.81MB, 6000 × 4500 jpg
stock image Charts of Financial Instruments

Charts Of Financial Instruments

Image, 14.28MB, 6016 × 4016 jpg
stock image Stock Market Down

Stock Market Down

Image, 6.9MB, 5940 × 4200 jpg
stock image sad broker with falling down graph

Sad Broker With Falling Down Graph

Image, 22.22MB, 4896 × 4896 jpg
stock image Recovery or Recession

Recovery Or Recession

Image, 5.19MB, 3888 × 2592 jpg
stock image Business graph

Business Graph

Image, 1.45MB, 4000 × 2250 jpg
stock image Graph of stock market data and financial with stock analysis ind

Graph Of Stock Market Data And Financial With Stock Analysis Ind

Image, 6.03MB, 5184 × 3456 jpg
stock vector abstract background of economy crisis down stock market graph

Abstract Background Of Economy Crisis Down Stock Market Graph

Vector, 9.95MB, 6000 × 3871 eps
stock image Graph of stock market data and financial with stock analysis indicator. Candle stick graph chart of stock market ,stock market data graph chart on LED display concept.

Graph Of Stock Market Data And Financial With Stock Analysis Indicator. Candle Stick Graph Chart Of Stock Market ,stock Market Data Graph Chart On LED Display Concept.

Image, 7.62MB, 5184 × 3456 jpg
stock image Index graph of stock market financial indicator analysis on LED.

Index Graph Of Stock Market Financial Indicator Analysis On LED.

Image, 6.04MB, 5184 × 3456 jpg
stock image Index graph of stock market financial indicator analysis on LED.

Index Graph Of Stock Market Financial Indicator Analysis On LED.

Image, 12.77MB, 5184 × 3456 jpg
stock image Stock market indicator and financial data view from LED. Double

Stock Market Indicator And Financial Data View From LED. Double

Image, 6.23MB, 5184 × 3456 jpg
stock image Financial data on a monitor,selective focus on LED monitor, stock market data on LED display concept

Financial Data On A Monitor,selective Focus On LED Monitor, Stock Market Data On LED Display Concept

Image, 5.54MB, 5184 × 3456 jpg
stock image Index graph of stock market financial indicator analysis on LED.

Index Graph Of Stock Market Financial Indicator Analysis On LED.

Image, 11.24MB, 5184 × 3456 jpg
stock image Index graph of stock market financial indicator analysis on LED.

Index Graph Of Stock Market Financial Indicator Analysis On LED.

Image, 5.77MB, 5184 × 3456 jpg
stock image Stock market indicator and financial data view from LED. Double

Stock Market Indicator And Financial Data View From LED. Double

Image, 12.72MB, 5184 × 3456 jpg
stock image Stock market indicator and financial data view from LED. Double

Stock Market Indicator And Financial Data View From LED. Double

Image, 6.74MB, 5184 × 3456 jpg
stock image Stock market crash, declined economic, graph falling down and digital indicators overlaps modernistic city. Double exposure.

Stock Market Crash, Declined Economic, Graph Falling Down And Digital Indicators Overlaps Modernistic City. Double Exposure.

Image, 13.78MB, 5720 × 3608 jpg
stock image Index graph of stock market financial indicator analysis on LED.

Index Graph Of Stock Market Financial Indicator Analysis On LED.

Image, 8.23MB, 5102 × 3401 jpg
stock image Graph of stock market data and financial with stock analysis ind

Graph Of Stock Market Data And Financial With Stock Analysis Ind

Image, 8.37MB, 5184 × 3456 jpg
stock image Stock market crash, declined economic, graph falling down and digital indicators overlaps modernistic city. Double exposure.

Stock Market Crash, Declined Economic, Graph Falling Down And Digital Indicators Overlaps Modernistic City. Double Exposure.

Image, 6.78MB, 3109 × 1961 jpg
stock image Economic crisis concept shown by declining graphs and digital indicators overlap modernistic city background. Double exposure.

Economic Crisis Concept Shown By Declining Graphs And Digital Indicators Overlap Modernistic City Background. Double Exposure.

Image, 9.28MB, 5156 × 3252 jpg
stock image Financial data on a monitor,candle stick graph of stock market ,

Financial Data On A Monitor,candle Stick Graph Of Stock Market ,

Image, 7.09MB, 5184 × 3456 jpg
stock image Business man on digital stock market financial indicator backgro

Business Man On Digital Stock Market Financial Indicator Backgro

Image, 11.05MB, 5184 × 3331 jpg
stock image Stock market indicator and financial data view from LED. Double

Stock Market Indicator And Financial Data View From LED. Double

Image, 9.44MB, 5153 × 3456 jpg
stock image Economic crisis concept shown by declining graphs and digital indicators overlap modernistic city background. Double exposure.

Economic Crisis Concept Shown By Declining Graphs And Digital Indicators Overlap Modernistic City Background. Double Exposure.

Image, 21MB, 5720 × 3608 jpg
stock image Stock market prices falling, candlestick chart monitor closeup, detail, price going down fast, market crash simple concept. Stocks, cryptocurrency, forex trading risk, failure abstract concept, nobody

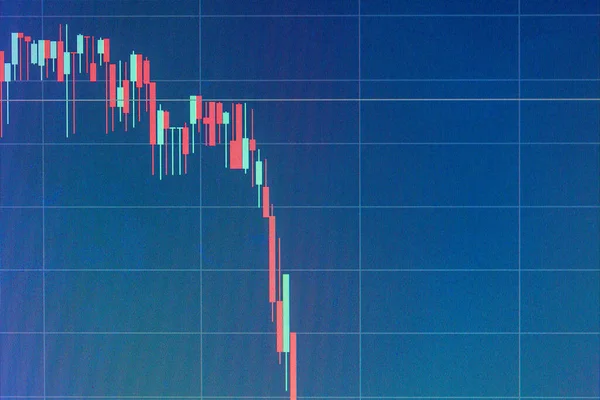
Stock Market Prices Falling, Candlestick Chart Monitor Closeup, Detail, Price Going Down Fast, Market Crash Simple Concept. Stocks, Cryptocurrency, Forex Trading Risk, Failure Abstract Concept, Nobody

Image, 33.18MB, 5616 × 3744 jpg
stock image Index graph of stock market financial indicator analysis on LED.

Index Graph Of Stock Market Financial Indicator Analysis On LED.

Image, 8.16MB, 5184 × 3456 jpg
stock image Index graph of stock market financial indicator analysis on LED.

Index Graph Of Stock Market Financial Indicator Analysis On LED.

Image, 6.6MB, 5184 × 3456 jpg
stock image Economic crisis concept shown by declining graphs and digital indicators overlap modernistic city background. Double exposure.

Economic Crisis Concept Shown By Declining Graphs And Digital Indicators Overlap Modernistic City Background. Double Exposure.

Image, 14.62MB, 5720 × 3608 jpg
stock image Stock crisis red price drop down chart fall

Stock Crisis Red Price Drop Down Chart Fall

Image, 16.26MB, 5609 × 3744 jpg
stock image Double exposure stock financial

Double Exposure Stock Financial

Image, 10.8MB, 6000 × 4000 jpg
stock vector Vector : Decreasing graph and arrow on red stock board

Vector : Decreasing Graph And Arrow On Red Stock Board

Vector, 10.94MB, 4677 × 3307 eps
stock image Stock market

Stock Market

Image, 7.46MB, 5184 × 3456 jpg
stock image Index graph of stock market financial indicator analysis on LED.

Index Graph Of Stock Market Financial Indicator Analysis On LED.

Image, 2.56MB, 4557 × 3038 jpg
stock image Index graph of stock market financial indicator analysis on LED.

Index Graph Of Stock Market Financial Indicator Analysis On LED.

Image, 6.31MB, 5184 × 3456 jpg
Page 1 >> Next