
Stock image Enzyme Kinetics

Diagram Of Drug Metabolism Inducer Process - Effect On CYP450 Enzymes Synthesis, Drug Metabolism, Half Life, Plasma Concentration And Pharmacological Effect. Simple Flow Chart Illustration.
Vector, 5.45MB, 2000 × 2000 eps

Diagram Of Drug Metabolism Inducer Process - Effect On CYP450 Enzymes Synthesis, Drug Metabolism, Half Life, Plasma Concentration And Pharmacological Effect. Simple Flow Chart Illustration.
Vector, 5.45MB, 2000 × 2000 eps

Diagram Of Drug Metabolism Inhibitor Process - Effect On CYP450 Enzymes Synthesis, Drug Metabolism, Half Life, Plasma Concentration And Pharmacological Effect. Simple Flow Chart Illustration.
Vector, 5.44MB, 2000 × 2000 eps

Diagram Of Drug Metabolism Inhibitor Process - Effect On CYP450 Enzymes Synthesis, Drug Metabolism, Half Life, Plasma Concentration And Pharmacological Effect. Simple Flow Chart Illustration.
Vector, 5.44MB, 2000 × 2000 eps
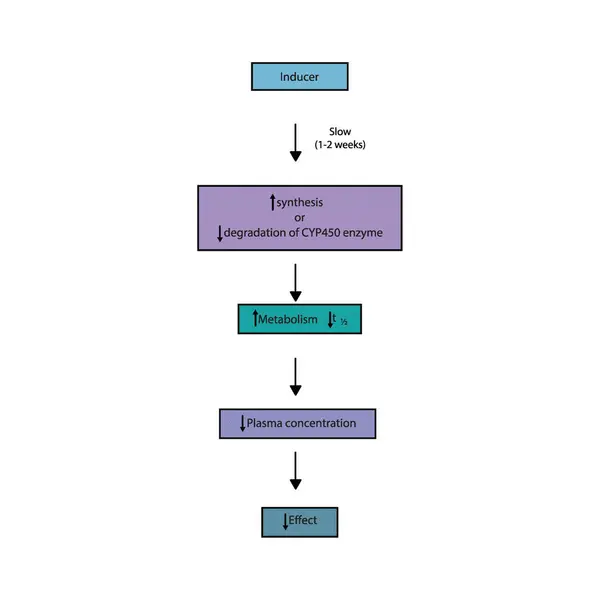
Diagram Of Drug Metabolism Inducer Process - Effect On CYP450 Enzymes Synthesis, Drug Metabolism, Half Life, Plasma Concentration And Pharmacological Effect. Simple Flow Chart Illustration.
Vector, 5.45MB, 2000 × 2000 eps

Okazaki Fragments Generation: Detailed Vector Illustration Of DNA Replication Process In White Background For Molecular Biology And Biochemistry Education
Vector, 0.42MB, 5000 × 3000 ai

Diagram Of Drug Metabolism Inducer Process - Effect On CYP450 Enzymes Synthesis, Drug Metabolism, Half Life, Plasma Concentration And Pharmacological Effect. Simple Flow Chart Illustration.
Vector, 5.44MB, 2000 × 2000 eps

Detailed Vector Illustration Of Enzyme Catalysis Reaction Stages: Biochemical Processes In White Background
Vector, 0.34MB, 5000 × 3000 ai

Detailed And Labeled Vector Illustration Of Components Of Pyruvate Dehydrogenase Complex For Biochemistry, Molecular Biology, And Health Science Education On White Background
Vector, 0.38MB, 5000 × 3000 ai

Diagram Of Drug Metabolism Inhibitor Process - Effect On CYP450 Enzymes Synthesis, Drug Metabolism, Half Life, Plasma Concentration And Pharmacological Effect. Simple Flow Chart Illustration.
Vector, 5.44MB, 2000 × 2000 eps

Diagram Of Drug Metabolism Inhibitor Process - Effect On CYP450 Enzymes Synthesis, Drug Metabolism, Half Life, Plasma Concentration And Pharmacological Effect. Simple Flow Chart Illustration.
Vector, 5.44MB, 2000 × 2000 eps

Diagram Of Drug Metabolism Inhibitor Process - Effect On CYP450 Enzymes Synthesis, Drug Metabolism, Half Life, Plasma Concentration And Pharmacological Effect. Simple Flow Chart Illustration.
Vector, 5.44MB, 2000 × 2000 eps


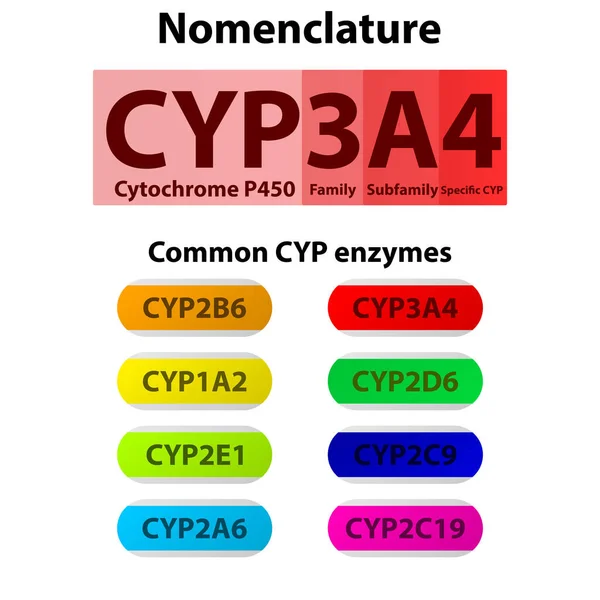
CYP Cytochrome P450 Nomenclature And Examples Of Common Enzymes. Pharmacology And Biochemistry Infographic For Education.
Vector, 6.83MB, 8333 × 8333 eps

General Reaction Pathway Of Endergonic And Exergonic Reactions: Detailed Vector Illustration For Biochemistry And Molecular Biology Education On White Background
Vector, 0.37MB, 5000 × 3000 ai

Page 1 >> Next