
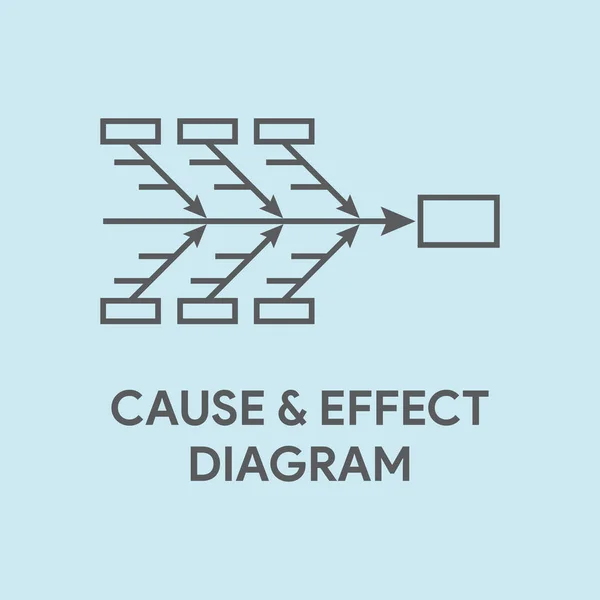
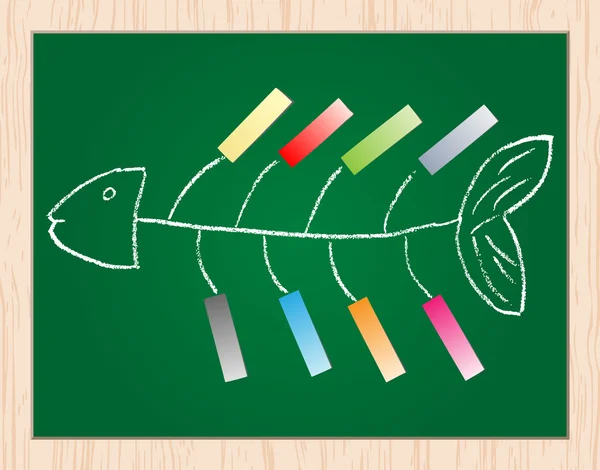
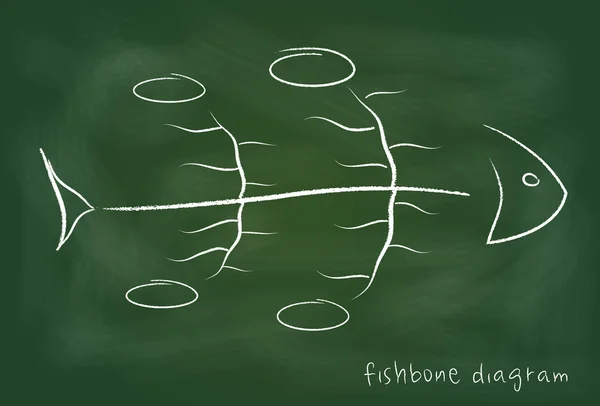
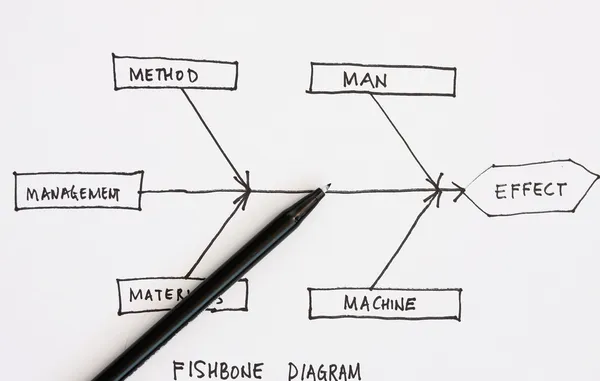
Stock image Fish Bone Diagram


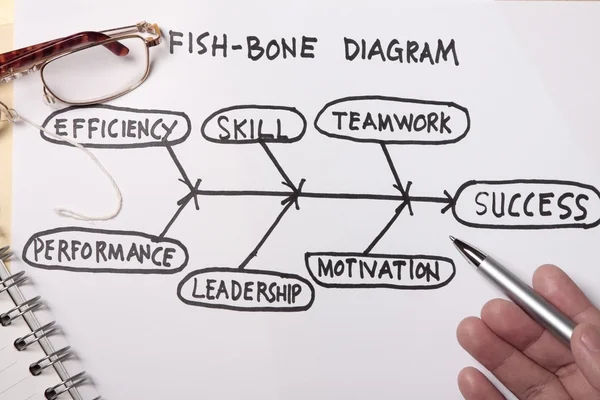
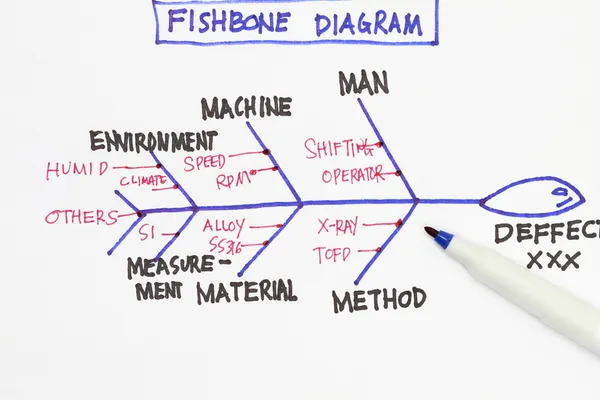
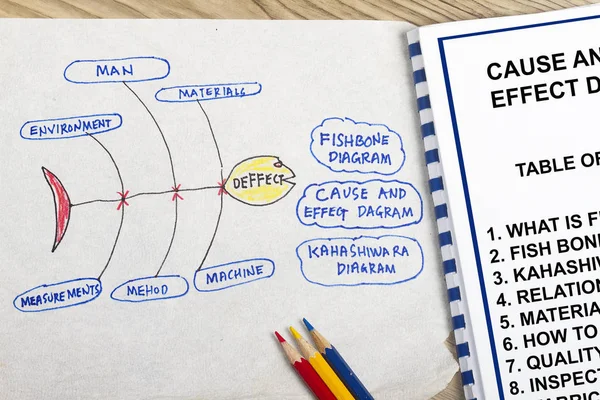


Fishbone Diagram Tool To Analyze Cause Of Problem, Root Cause Analysis Or Finding Solution To Solve Problem, Analyze Effect Or Impact Concept, Businessman Drawing Fishbone Diagram To Analyze Problem.
Vector, 5.67MB, 6250 × 4167 eps
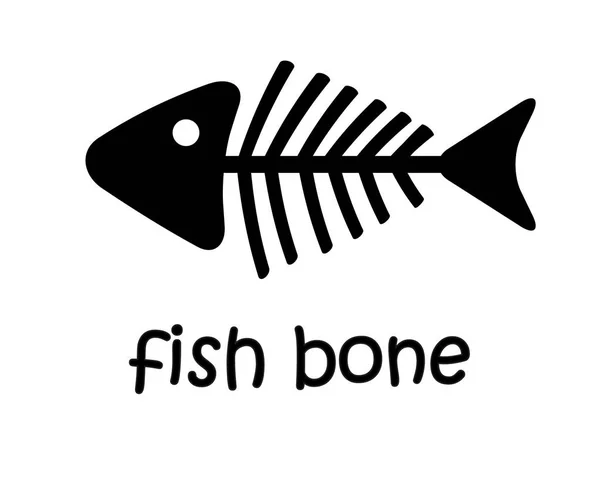
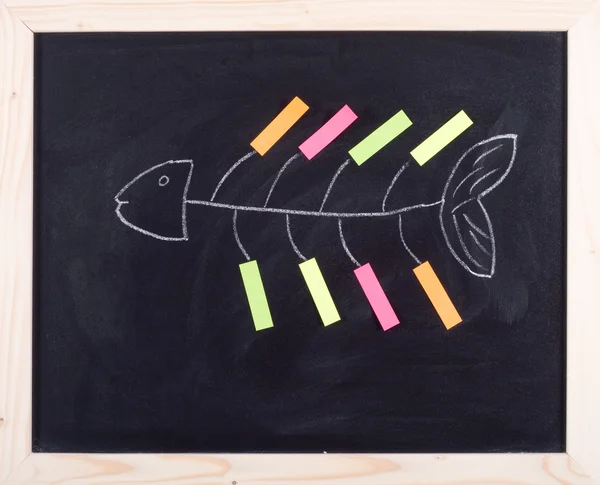
Black Fish Skeleton Fishbone With Text Isolated On White Simple Vector
Vector, 0.48MB, 4300 × 3500 eps
Fishbone Icon. Trendy Fishbone Logo Concept On White Background From Museum Collection. Suitable For Use On Web Apps, Mobile Apps And Print Media.
Vector, 0.74MB, 6944 × 6944 eps

Fishbone Infographic Design Collection With Colorful Text Slot. Infographic Design On White Background, Stylish Infographic Elements For Business Presentation Concept.
Vector, 5.98MB, 5209 × 5209 eps
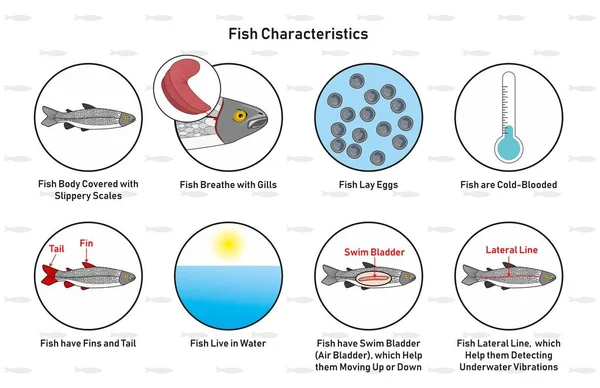
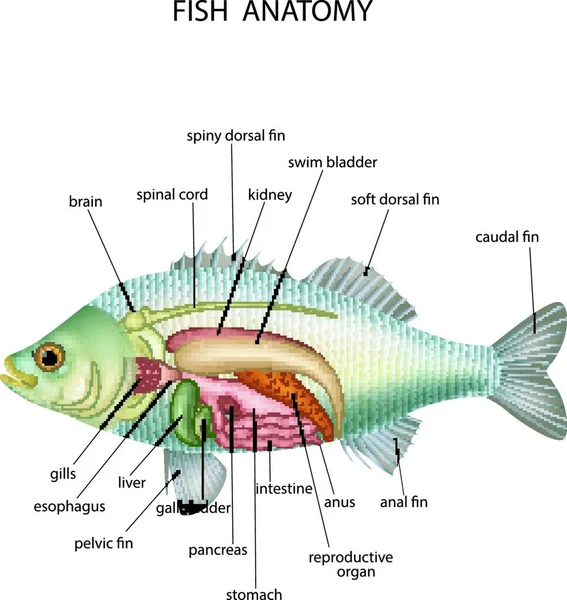
Fish Characteristics Infographic Diagram Including Slippery Scales Gills Laying Eggs Cold Blooded Fins Tail Living In Water Swim Bladder And Lateral Line For Biology Science Education
Vector, 2.26MB, 2536 × 1641 eps

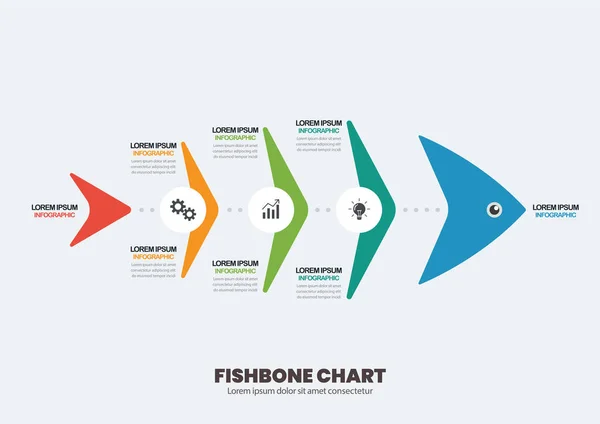
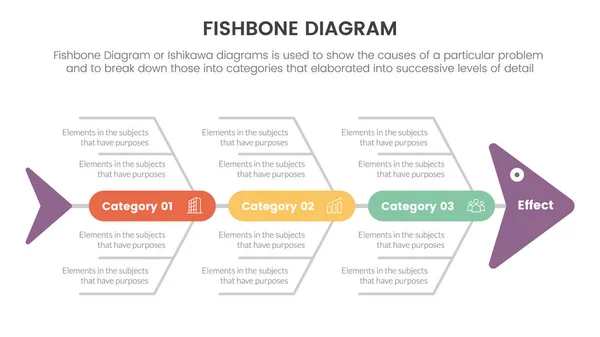
Fishbone Diagram Fish Shaped Infographic With Big Circle And Icon Concept For Slide Presentation Vector
Vector, 1.74MB, 5760 × 3240 eps
Fishbone Chart Diagram Infographic. Business Concept Vector Illustration
Vector, 6.39MB, 7073 × 5000 eps
Fishbone Diagram Fish Shaped Infographic With Round Shape Box Point On Center Concept For Slide Presentation Vector
Vector, 1.69MB, 5760 × 3240 eps
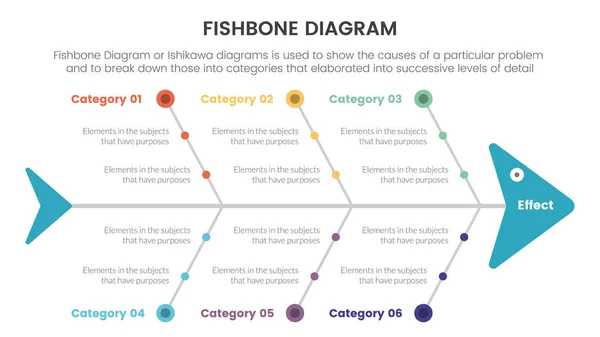
Fishbone Diagram Fish Shaped Infographic With Small Circle Dot Connection Information Concept For Slide Presentation Vector
Vector, 1.72MB, 5760 × 3240 eps

Fishbone Diagram Fish Shaped Infographic With Small Circle Dot Connection Information With Fish Shape Background Concept For Slide Presentation Vector
Vector, 1.72MB, 5760 × 3240 eps
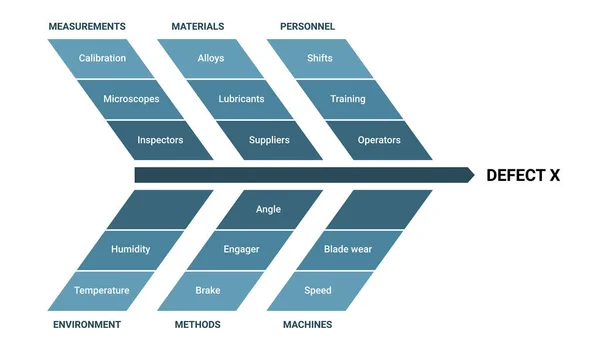
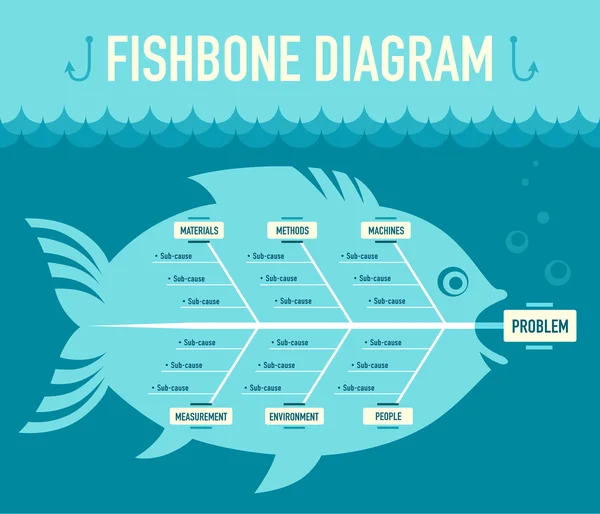
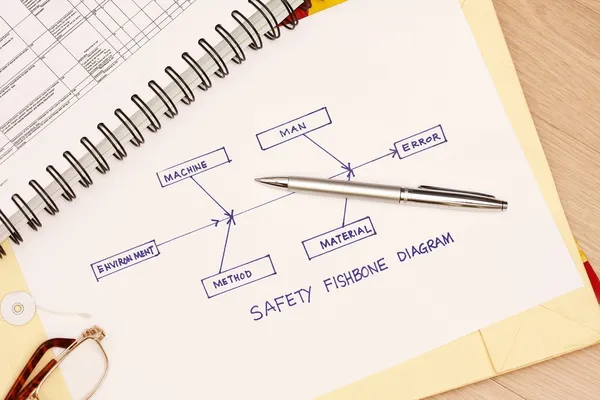
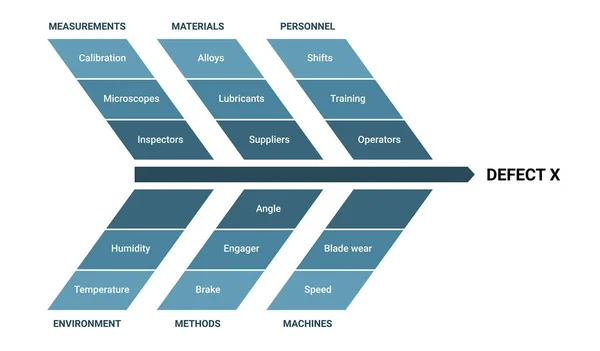
Fishbone Diagram Ishikawa Methodology Infographic With Measurements, Materials, Personnel, Environment, Methods, Machines. Colored Scheme Of Cause And Effect Method For Managers.
Vector, 0.73MB, 5266 × 3090 eps


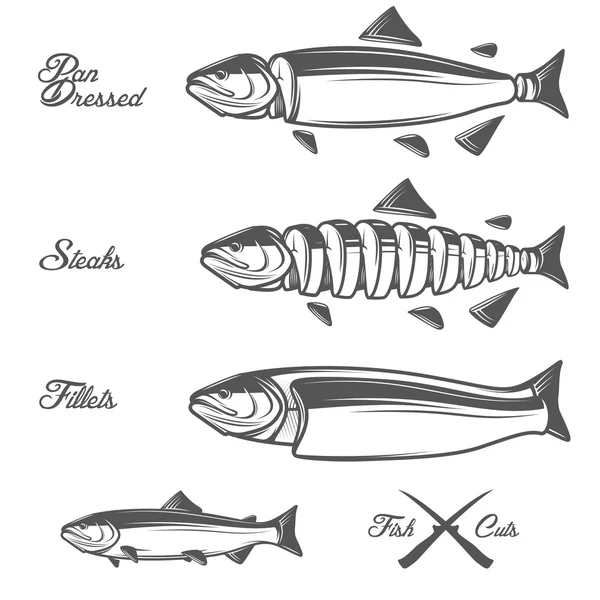
The Vector Featured A Fish Skeleton Or Fishbone For A Presentation And Illustration. The Fish Has 6 Parts Of Editable Text To Analyze The Cause Of Effects Or Problems In The Company Or Production.
Vector, 4.22MB, 5400 × 3038 eps

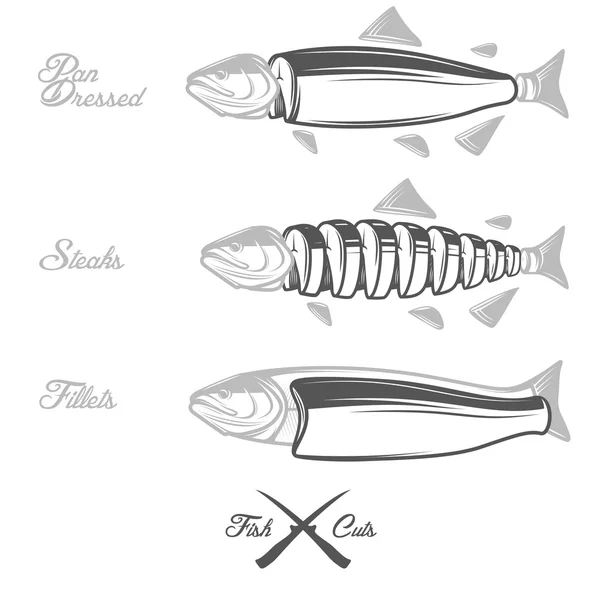
The Vector Featured A Fish Skeleton Or Fishbone For A Presentation And Illustration. The Fish Has 6 Parts Of Editable Text To Analyze The Cause Of Effects Or Problems In The Company Or Production.
Vector, 3.89MB, 5400 × 3038 eps

The Vector Featured A Fish Skeleton Or Fishbone For A Presentation And Illustration. The Fish Has 6 Parts Of Editable Text To Analyze The Cause Of Effects Or Problems In The Company Or Production.
Vector, 2.65MB, 5400 × 3038 eps
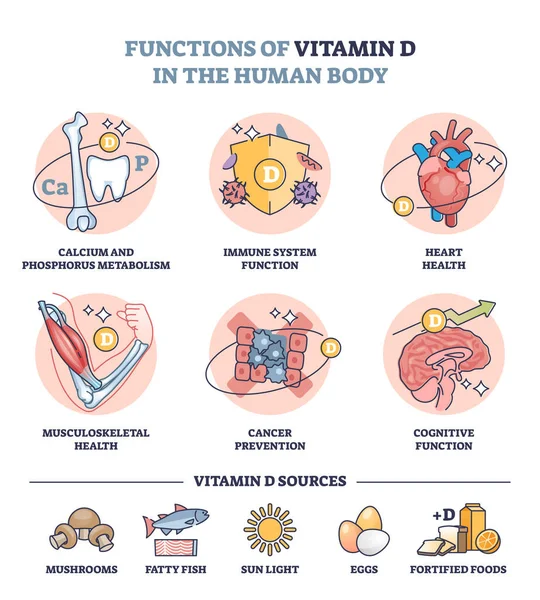
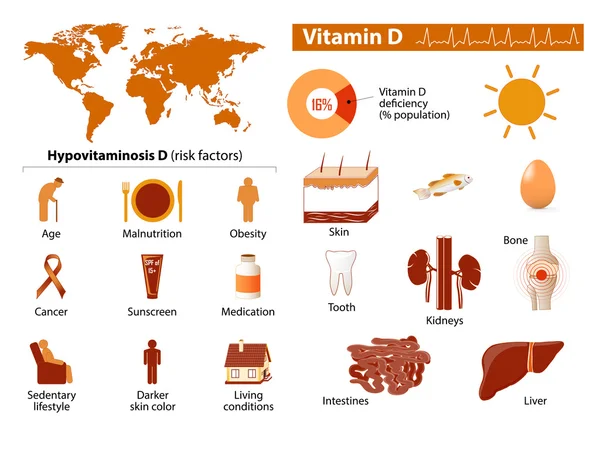
Functions Of Vitamin D In Human Body And Immune System Sources In Food Outline Diagram. Labeled Educational Scheme With Health Benefits From Eating Ingredients And Sun Light Vector Illustration.
Vector, 7.05MB, 4000 × 4444 eps


Fish Bone Infographic Chart Business To Present Data, Progress, Direction, Infographic That Outlines The Steps Of The Management Process. Vector Illustration.
Vector, 5.34MB, 7520 × 5191 eps

Fish Bone Infographic Chart Business To Present Data, Progress, Direction, Infographic That Outlines The Steps Of The Management Process. Vector Illustration.
Vector, 5.37MB, 8352 × 5765 eps
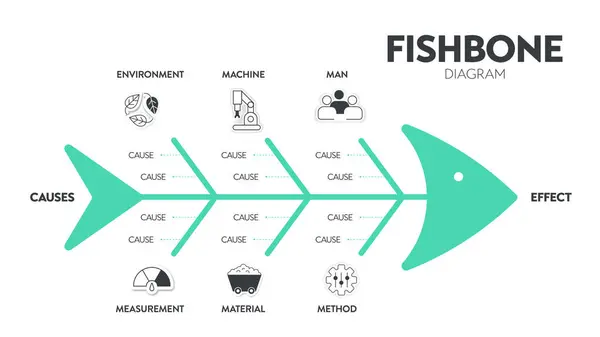
The Vector Featured A Fish Skeleton. A Template Is A Tool To Analyze And Brainstorm The Root Causes Of An Effect And Solution. A Fishbone Diagram Presentation Is A Cause-and-effect Ishikawa Diagram.
Vector, 3.56MB, 5400 × 3039 eps
Fish Bones Icon Animals Food, Spine Line And Flat Icons Set, Editable Stroke Isolated On White, Linear Vector Outline Illustration, Symbol Logo Design Style
Vector, 0.32MB, 6000 × 2500 eps
Fishbone Diagram Ishikawa Methodology Infographic With Measurements, Materials, Personnel, Environment, Methods, Machines. Colored Scheme Of Cause And Effect Method For Managers.
Vector, 0.73MB, 5266 × 3090 eps
Page 1 >> Next