
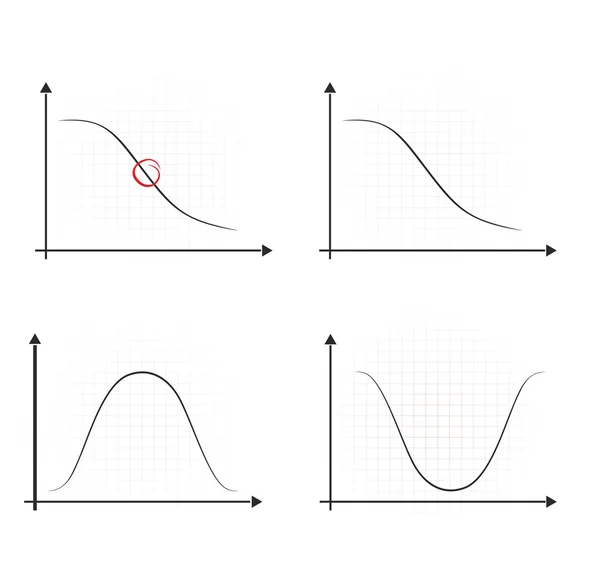
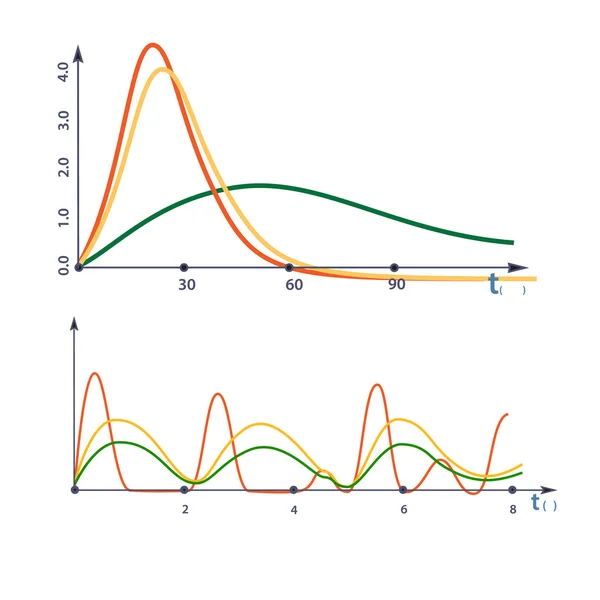
Stock image Function Chart

Outlier Graphic Result As Different Statistics Data Point Tiny Person Concept
Vector, 0.42MB, 6000 × 3140 eps


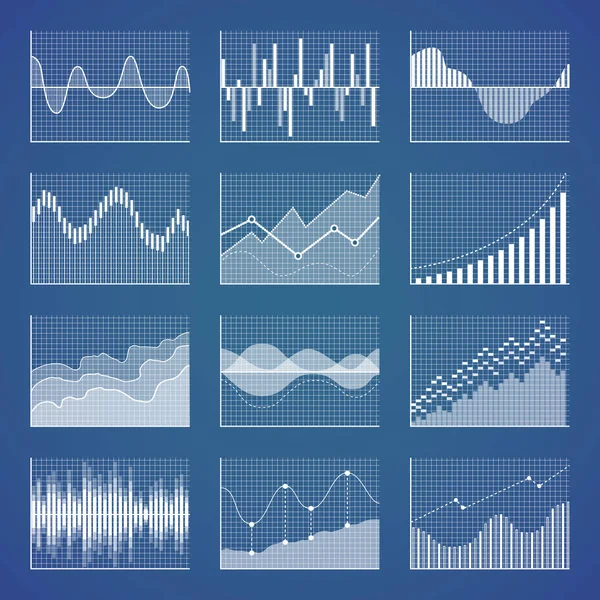
Set Of Graphs, Diagrams And Statistics Icons. Premium Quality Symbol Collection. Icons Can Be Used For Web, App And UI Design.
Vector, 3.15MB, 5008 × 5008 eps
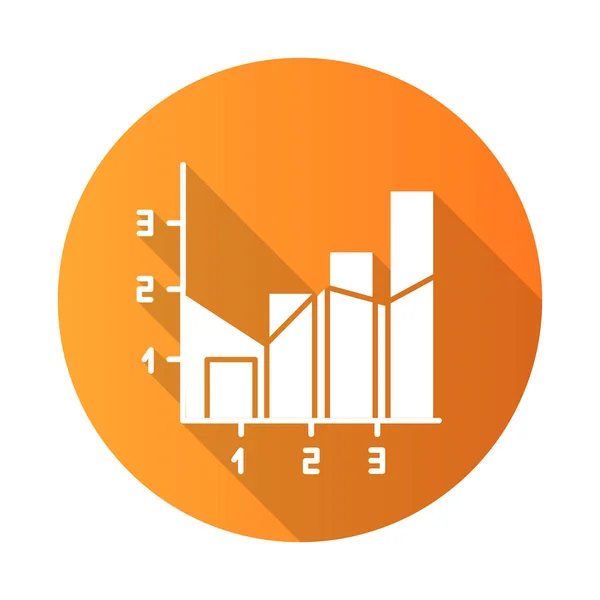
Mixed Chart Orange Flat Design Long Shadow Glyph Icon. Vertical Histogram With Linear Elements. Information Chart. Graph Business Presentation. Diagram Marketing. Vector Silhouette Illustration
Vector, 0.59MB, 5000 × 5000 eps


Infographic Template For Business. Modern Timeline Diagram Calendar 2019 With Quarters, Presentation Vector Infographic.
Vector, 5.3MB, 6500 × 2500 eps

Set Of Graphs, Diagrams And Statistics Icons. Premium Quality Symbol Collection. Icons Can Be Used For Web, App And UI Design.
Vector, 3.28MB, 5000 × 5000 eps
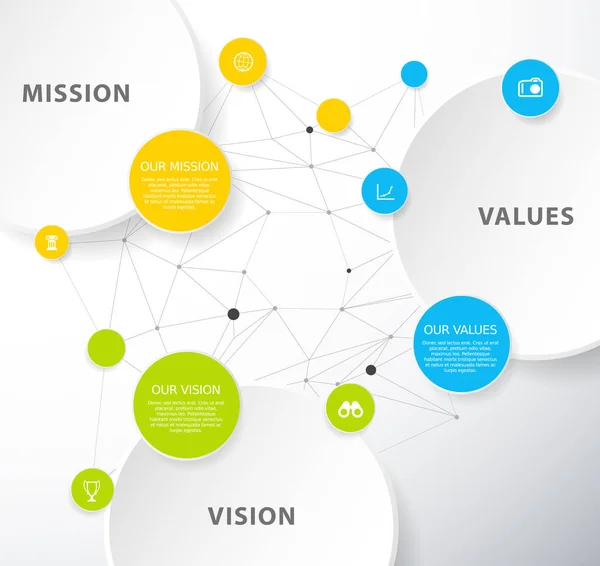
Vector Template With Colorful Circles And Mission, Vision And Values Diagram.
Vector, 9.32MB, 5000 × 4718 eps

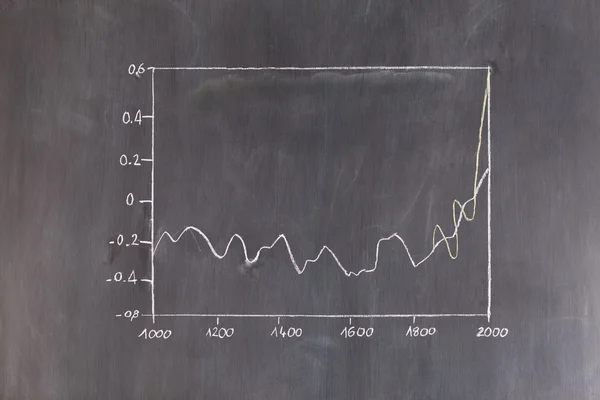
Analyst, Finance The Activities Of Companies And The Results Of The Economic Crisis Graph Indicator On A
Vector, 0.41MB, 3000 × 2400 eps

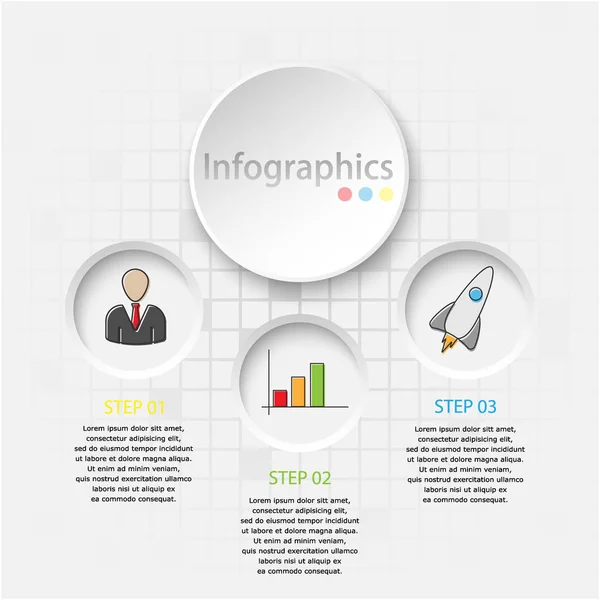
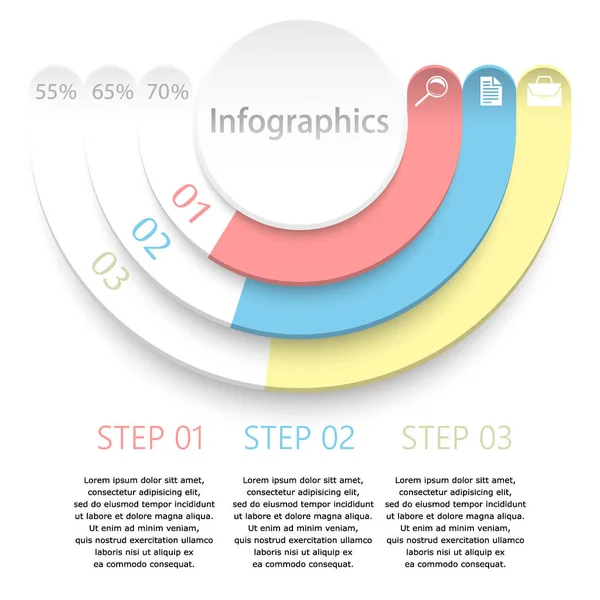
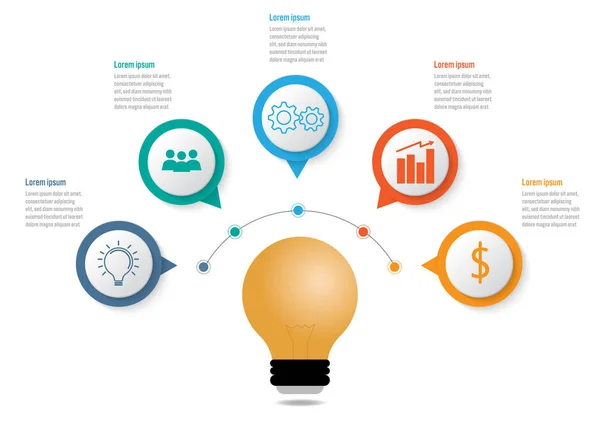
Business Infographic Template With 3 Options Circular Shape, Abstract Elements Diagram Or Processes And Business Flat Icon, Vector Business Template For Presentation.Creative Concept For Infographic
Vector, 2.05MB, 5847 × 4134 eps

Products Compare. Comparison Price Table With Option Line Icons. Versus Infographic Bar Chart. Product Choice Service Graph Vector Concept
Vector, 2.12MB, 6236 × 4009 eps


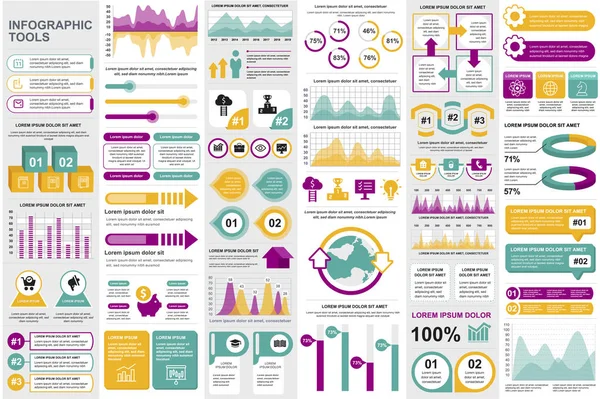
Business Infographic Elements Set. Data Visualization Bundle For Creative Marketing Presentation And Workflow Layout. Colorful Stock And Flow Charts, Line, Circle And Bar Graphs Vector Illustration.
Vector, 8.4MB, 6250 × 4162 eps


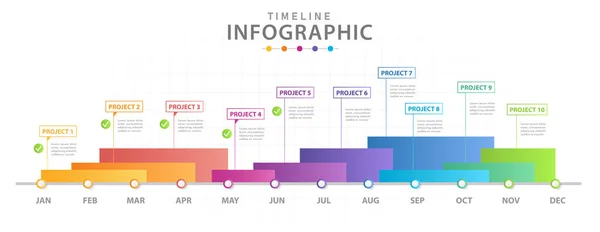
Infographic Business Template. 12 Months Modern Timeline Diagram Calendar. Concept Presentation.
Vector, 6.52MB, 14000 × 3100 eps
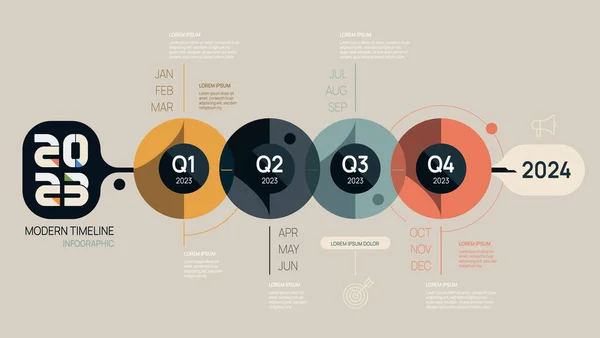
Infographic 2023 Template For Business. Modern Timeline Diagram Calendar And 4 Quarter Topics, Can Be Used For Vector Infographics, Flow Charts, Presentations, Websites.
Vector, 6.99MB, 6200 × 3500 eps
Business Infographic Elements Set. Business Processes Visualisation, Workflow And Flowchart. Colorful Stock And Flow Charts, Line, Circle And Bar Graphs Vector Illustration. Business And Accounting
Vector, 7.36MB, 6250 × 4162 eps

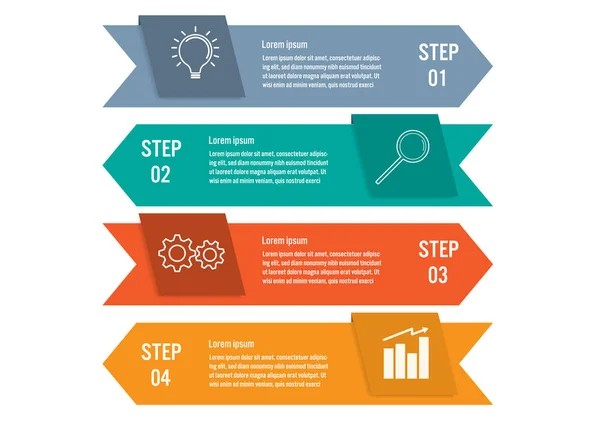
Business Infographic Template With 4 Options, Abstract Elements Diagram Or Processes And Business Flat Icon, Vector Business Template For Presentation.Creative Concept For Infographic
Vector, 2.55MB, 5847 × 4134 eps
Business Infographic Template With 5 Options, Abstract Elements Diagram Or Processes And Business Flat Icon, Vector Business Template For Presentation.Creative Concept For Infographic
Vector, 2.6MB, 5847 × 4134 eps
Infographic Template For Business. 5 Steps Modern Timeline Diagram With Circles, Presentation Vector Infographic.
Vector, 4.93MB, 6700 × 2600 eps


Page 1 >> Next