
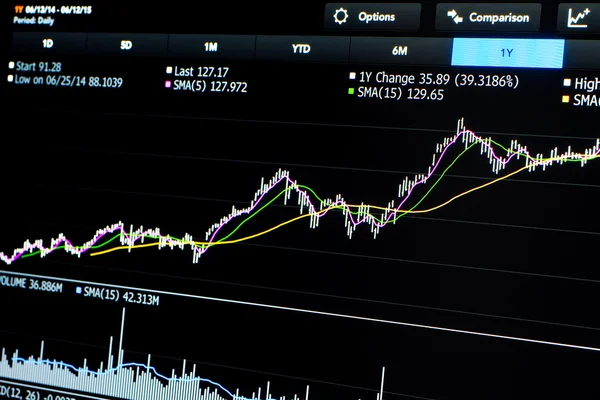
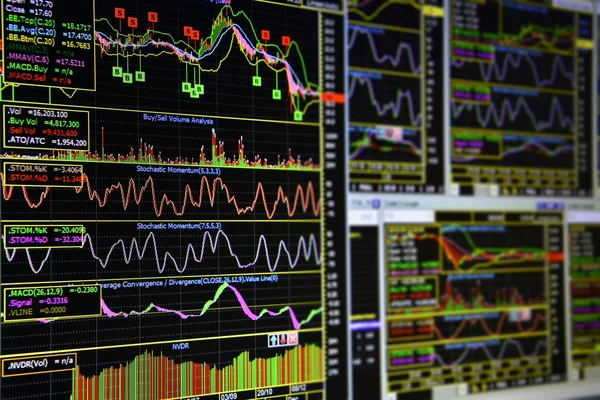
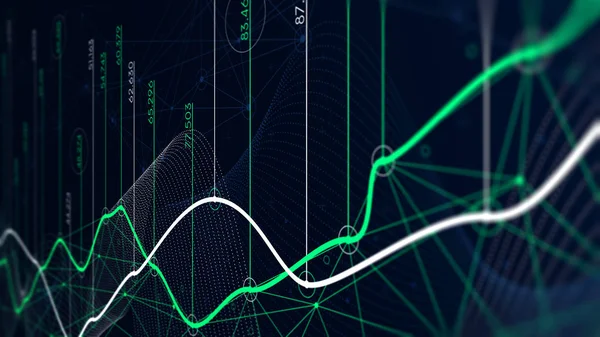
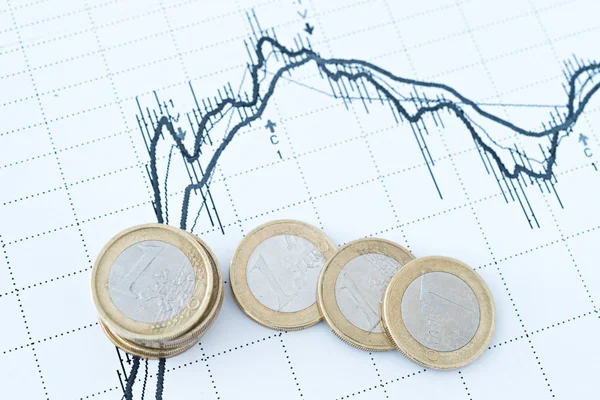
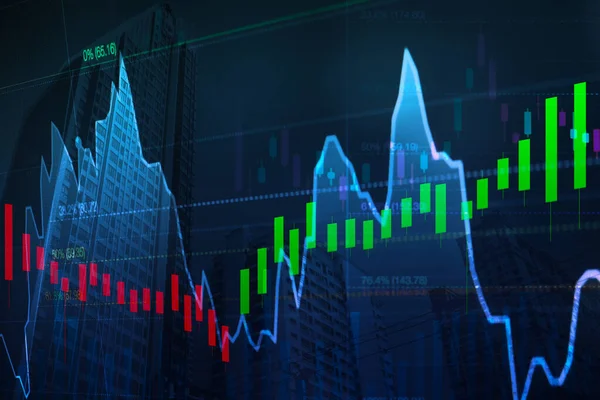
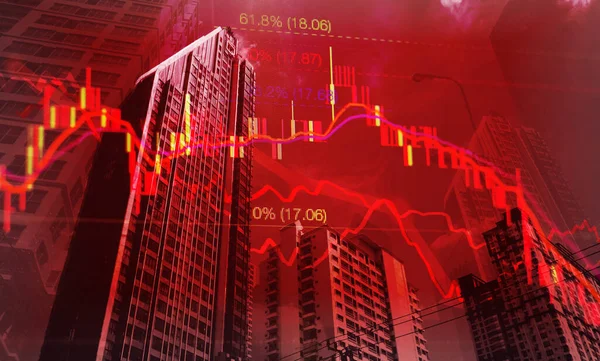
Stock image Indicators Index
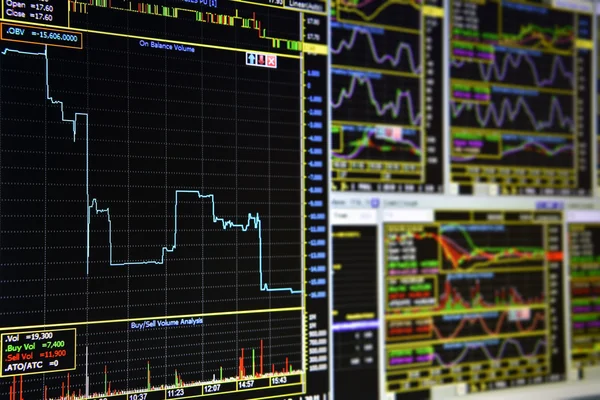
Charts Of Financial Instruments With Various Type Of Indicators Including Volume Analysis For Professional Technical Analysis On The Monitor Of A Computer. Fundamental And Technical Analysis Concept
Image, 4.51MB, 5488 × 3097 jpg


Technical Analysis Of A Financial Instrument With Software For Trading
Image, 3.44MB, 3050 × 2036 jpg

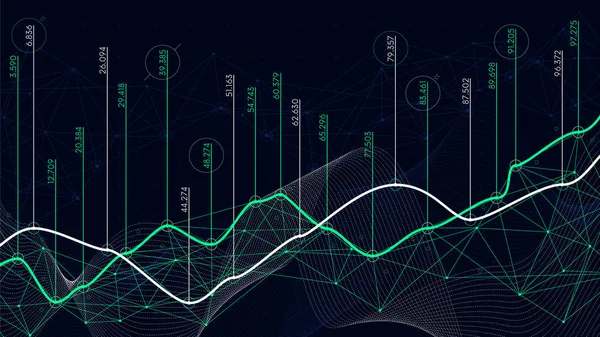
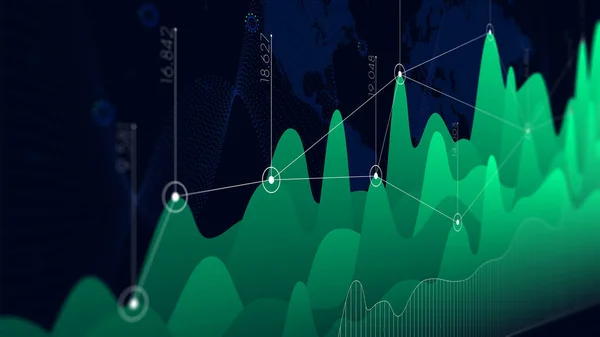
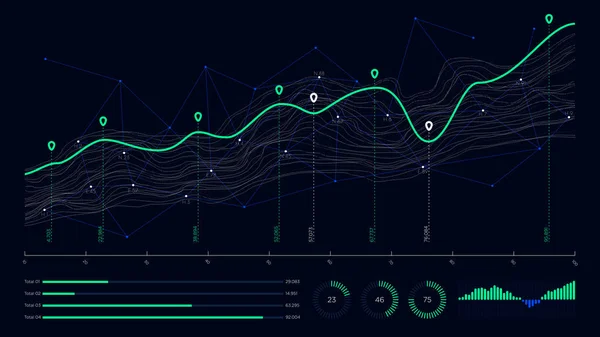
Business Analyzing Financial Statistics Display, Data Visualization, Vector Background
Vector, 0.84MB, 6299 × 3543 eps
Brokers Graphics Or Chart And Index Numbers, Statistics And Analysys
Vector, 0.52MB, 5000 × 3387 eps


Stock Market Boom, Skyrocketing Prices. Green Numbers Across The Board On A Screen. Financial Gains, Profit Concept.
Image, 4.51MB, 6016 × 4016 jpg

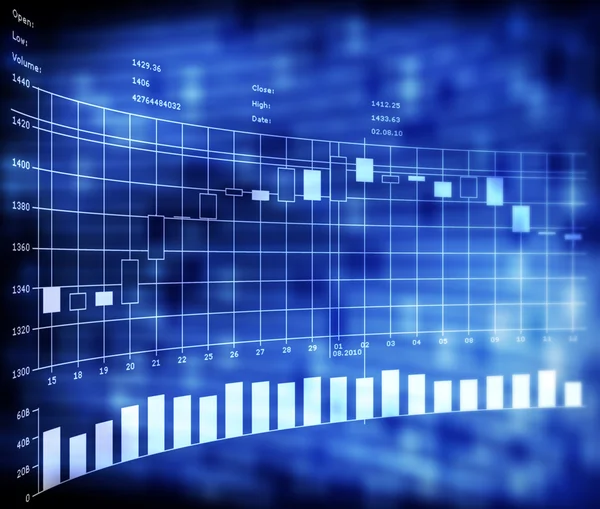
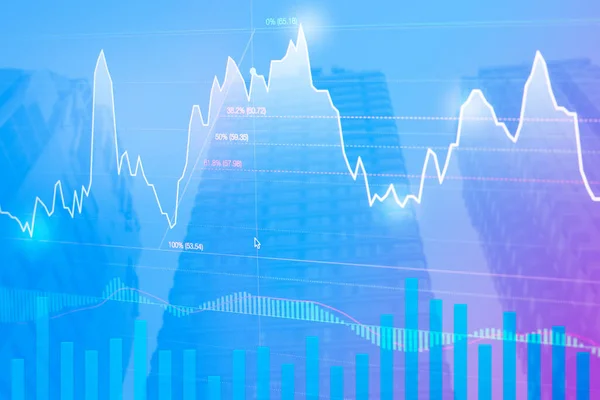
Business Analyzing Financial Statistics Display, Data Visualization, Background, Monitor Screen In Perspective
Image, 5.67MB, 10000 × 5626 jpg


Business Analysis Diagram In Sunlight. Finance Background Data Graph. Stock Market Concept
Image, 12.68MB, 5084 × 3343 jpg
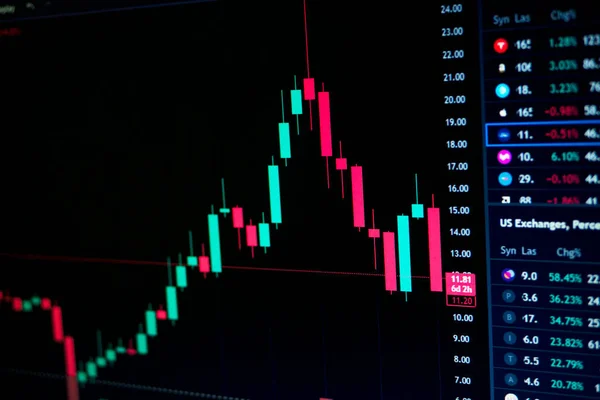
Stock Exchange Monitor Screen Candle Bar Chart Of Business Value Grown Up Concept.
Image, 12.15MB, 5472 × 3648 jpg
Technical Analysis Diagram. Finance Background Data Graph. Stock Market And Trading Concept
Image, 10.65MB, 4832 × 3519 jpg
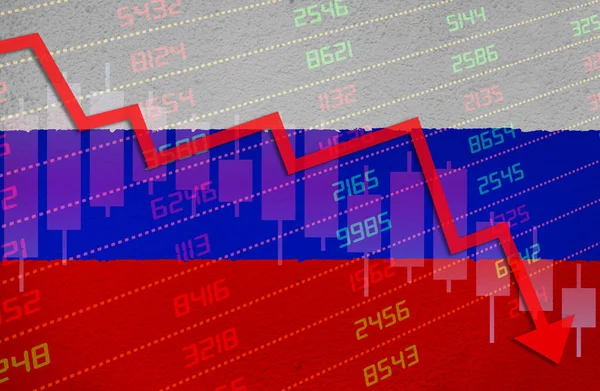
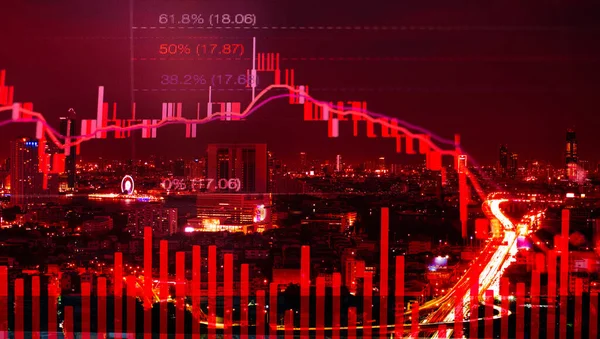
Economic Crisis With Stock Market Chart Arrow Down In Red Negative Territory Over Russian Flag Painted On Wall. Business And Financial Money Market Downturn Concept.
Image, 4.77MB, 4600 × 3000 jpg
Vector Speedometer Meter With Arrow For Dashboard With Green, Yellow, Orange And Red Indicators. Gauge Of Tachometer. Low, Medium, High And Risk Levels. Bitcoin Fear And Greed Index Cryptocurrency.
Vector, 0.23MB, 6500 × 4861 eps
Stock Market Graph With Fibonacci Indicator And Skyscraper On Background
Image, 14.73MB, 4280 × 2853 jpg
Financial Trading Graphs On Monitor. Background With Currency Bars And Candles
Image, 5.45MB, 3955 × 2708 jpg

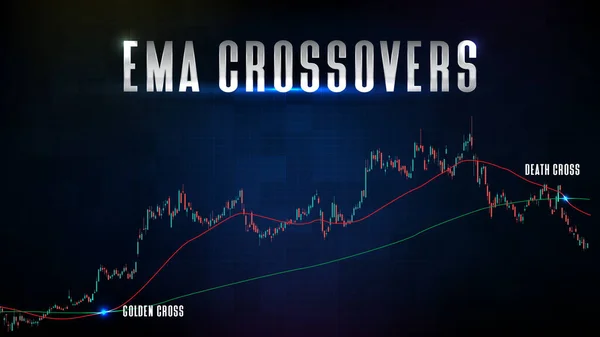
Abstract Background Of Stock Market And EMA Ema Crossover Golden Cross And Death Cross Indicator Technical Analysis Graph
Vector, 9.15MB, 6000 × 3375 eps
Vector Speedometer Meter With Arrow For Dashboard With Green, Yellow, Orange And Red Indicators. Gauge Of Tachometer. Low, Medium, High And Risk Levels. Bitcoin Fear And Greed Index Cryptocurrency.
Vector, 0.23MB, 6500 × 4861 eps
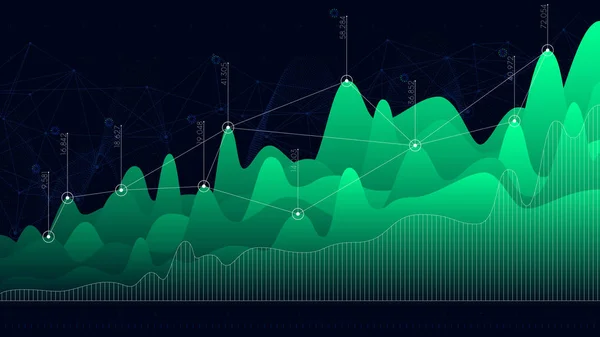
Digital Analytics Concept, Data Visualization, Financial Schedule, Vector
Vector, 13.4MB, 6300 × 3543 eps
Vector Color Speedometer Meter With Arrow For Dashboard With Green, Yellow, Orange And Red Indicators. Gauge Of Tachometer. Low, Medium, High And Risk Levels. Bitcoin Fear And Greed Index
Vector, 0.23MB, 6500 × 4861 eps

Charts Of Financial Instruments With Various Type Of Indicators Including Volume Analysis For Professional Technical Analysis On The Monitor Of A Computer. Fundamental And Technical Analysis Concept
Image, 17.53MB, 3995 × 3127 jpg


Financial Accounting Of Profit Summary Graphs Analysis. The Business Plan At The Meeting And Analyze Financial Numbers To View The Performance Of The Company.
Image, 6.06MB, 5472 × 3648 jpg
Vector Speedometer Meter With Arrow For Dashboard With Green, Yellow, Orange And Red Indicators. Gauge Of Tachometer. Low, Medium, High And Risk Levels. Bitcoin Fear And Greed Index Cryptocurrency.
Vector, 0.23MB, 6500 × 4861 eps

Double Exposure Stock Graph Indicator And Skyscraper In Green Background, Business Or Financial Chart Concept, Copy Space At Left
Image, 19.47MB, 5698 × 3798 jpg
Stock Graph Chart With Fibonacci Indicator In Bear Markets, Stock Exchange In Bear Concept
Image, 17.72MB, 4928 × 2970 jpg

Financial Chart With Various Indicators And Graphs At Abstractl Dark Backgound. 3D Render
Image, 4.12MB, 4500 × 3000 jpg
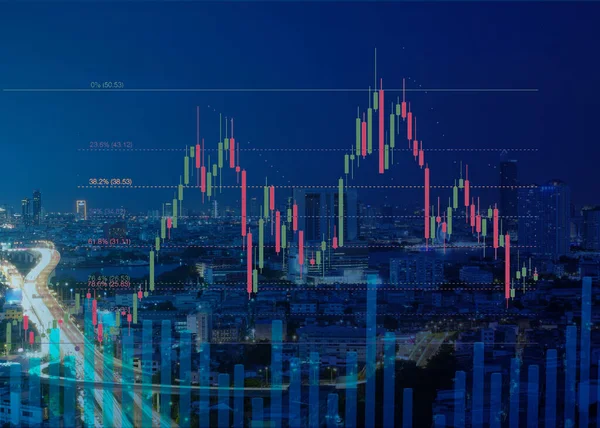
Stock Graph Chart With Fibonacci Indicator And Cityscape Night View On Background
Image, 18.8MB, 5196 × 3707 jpg
Infographic Dashboard Design Graphs Business Analytics, Monitor Screen In Perspective
Image, 4.72MB, 10000 × 5626 jpg

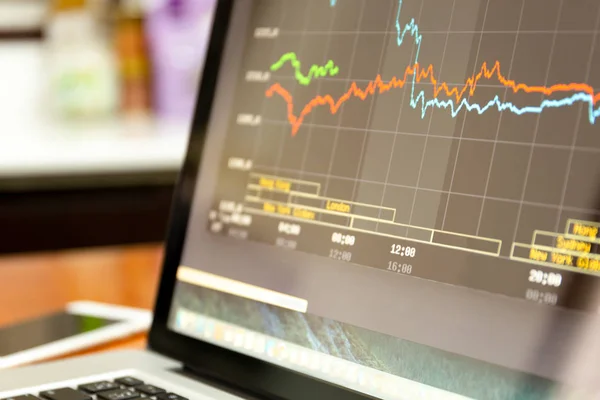
Laptop With Business And Financial Graph On The Screen And Blurred Cell Phone
Image, 7.78MB, 5463 × 3642 jpg
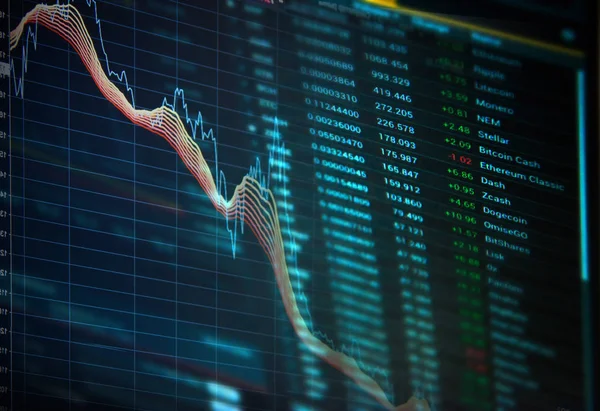
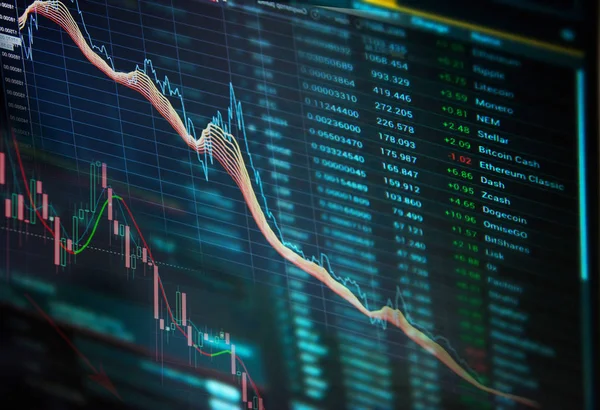
Stock Market Trading, Cryptocurrency, Forex, With Price Chart Technical Indicators And Number Data Layout Template For Financial Trading And Investment. Graph On A Personal Computer Monitor. Selective Focus.
Image, 10.77MB, 4592 × 3064 jpg
Digital Business Analytics Concept, Data Threads Graphic Visualization
Vector, 6.79MB, 6299 × 3543 eps
Stock Graph Chart Analysis Downturn With Fibonacci Indicator Concept, Graph And Cityscape With Red Color
Image, 23.81MB, 5621 × 3179 jpg
Page 1 >> Next