
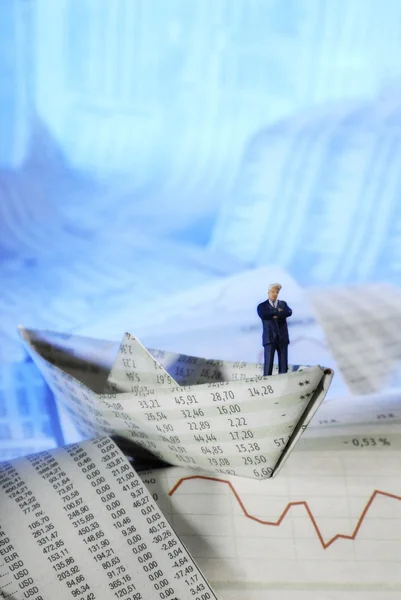
Stock image Loss By Exchange


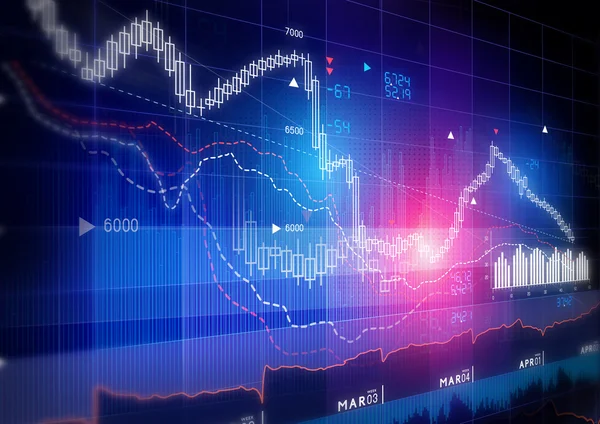

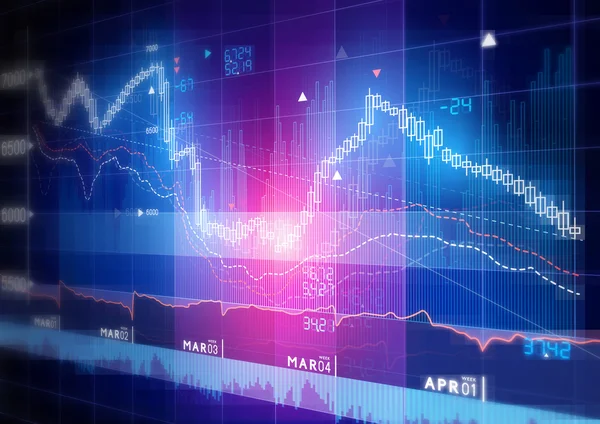
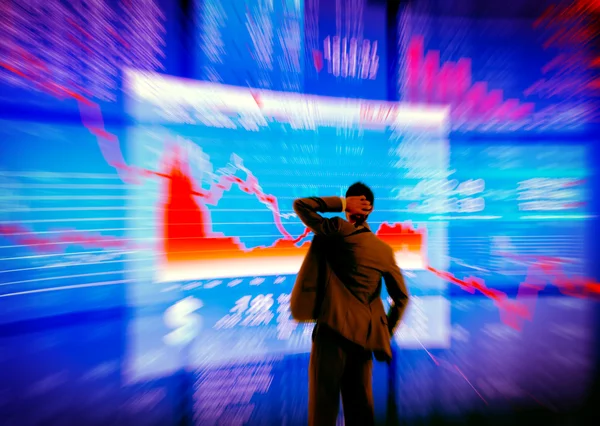
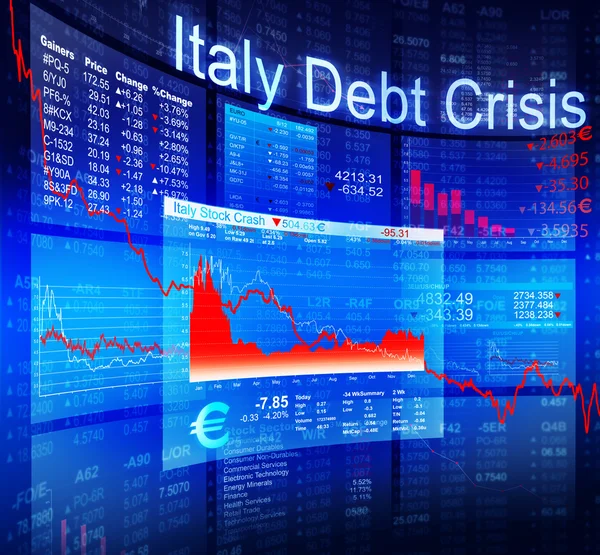
Nervous Tensioned Investors Analyzing Crisis Stock Market With Charts On Screen On Background, Falling Stock Exchange
Image, 5.64MB, 4500 × 3000 jpg
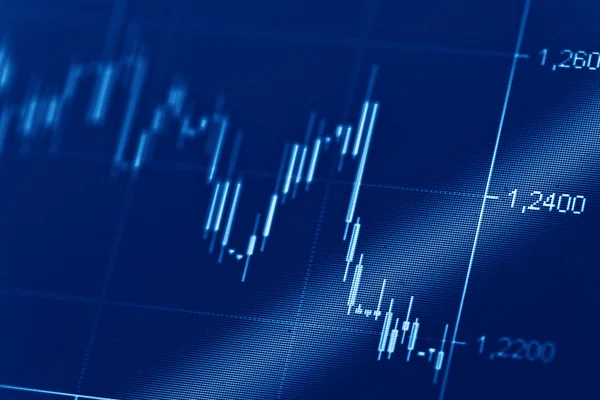
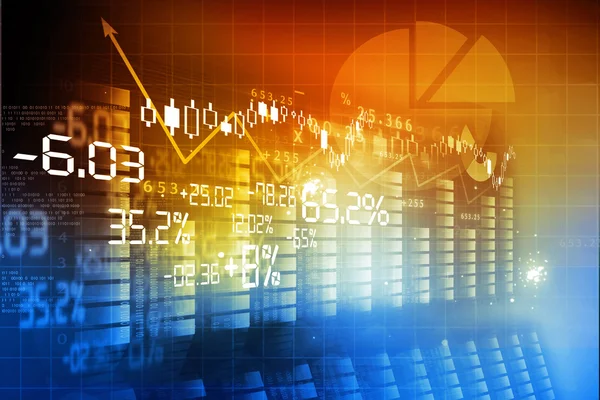
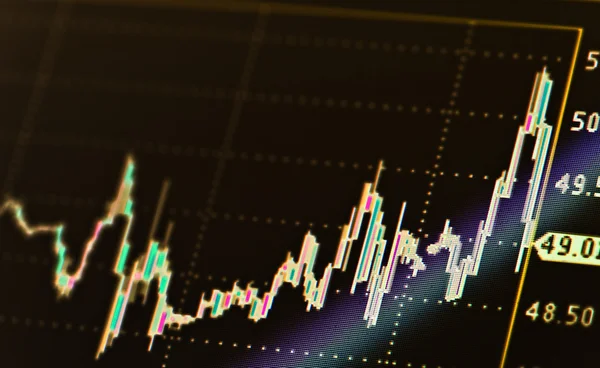
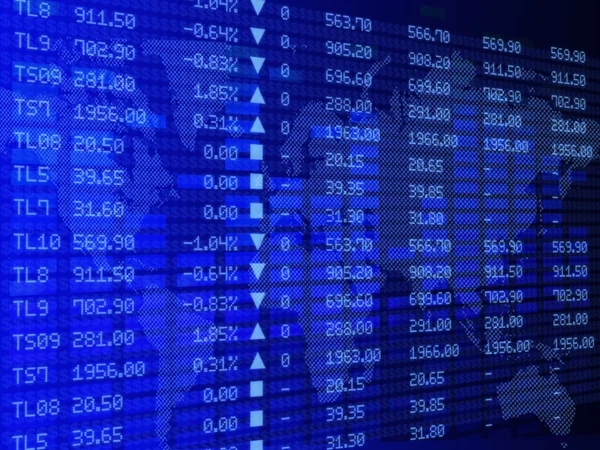
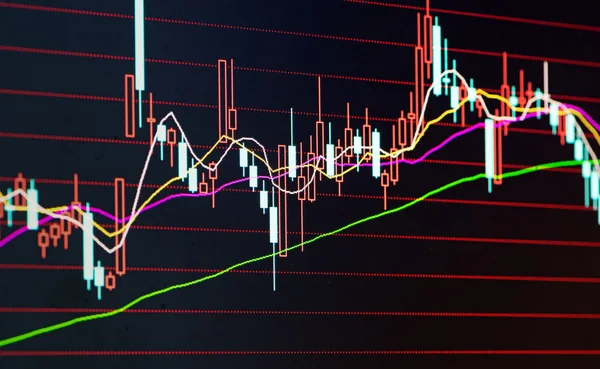
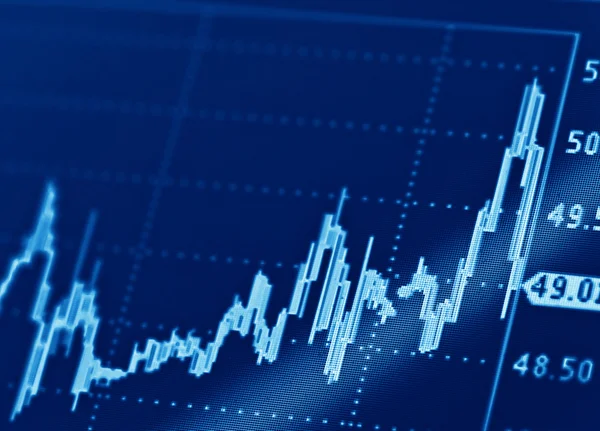
Close Up Shot On Digital Screen Candlestick Chart Of Stock Market Change And Volatility Prices Profit Or Loss
Image, 4.72MB, 6000 × 4000 jpg


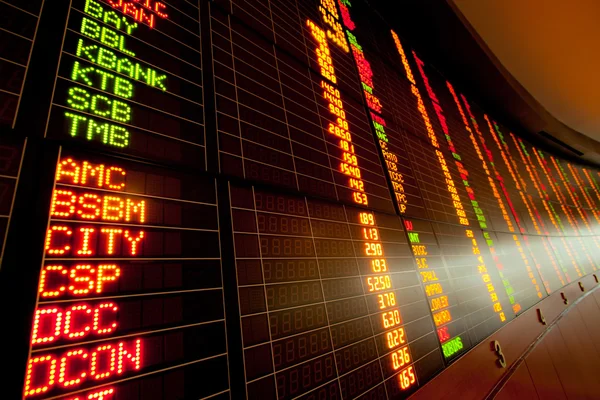

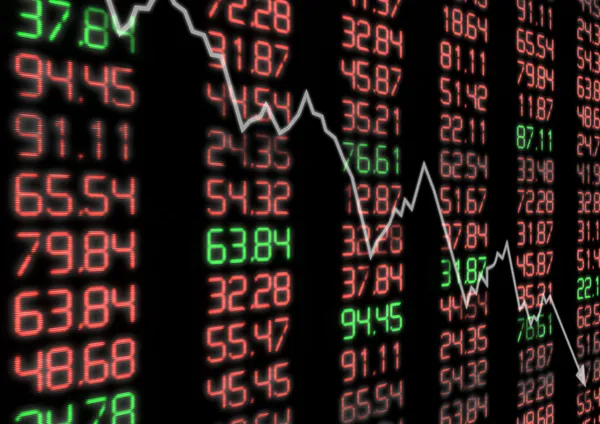
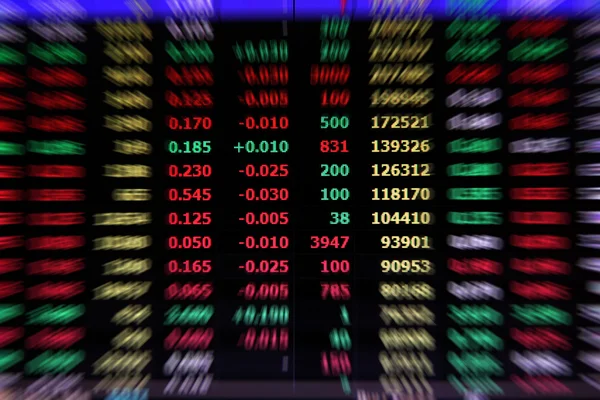
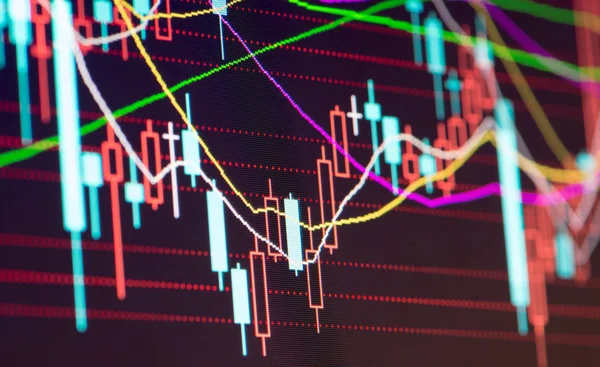
Close Up Of Green Stocks & Shares Figures On Black Background. Stock And Trading Data For Technical Analysis
Image, 12.01MB, 4163 × 3122 jpg

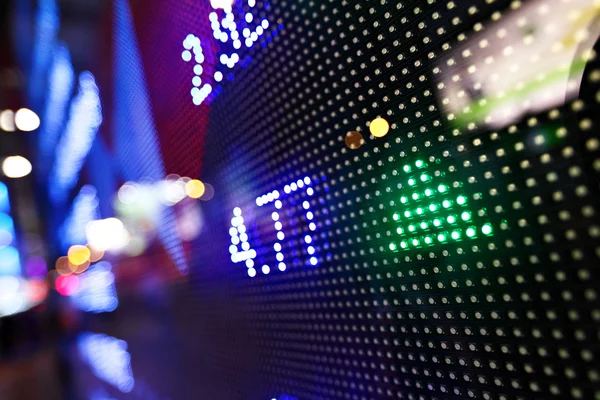

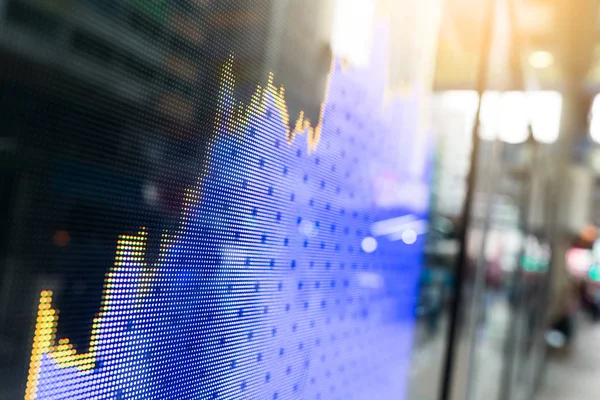
Hong Kong Display Stock Market Exchange And Charts Information Via Led Computer Monitor In Mong Kok Area Of Hong Kong Downtown District, Business Finance And Industry Concept
Image, 10.08MB, 6000 × 4000 jpg
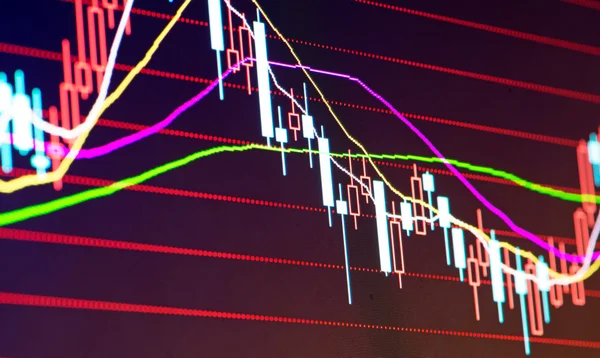


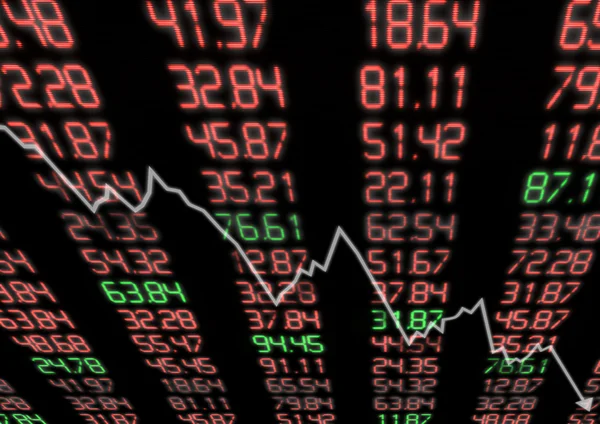
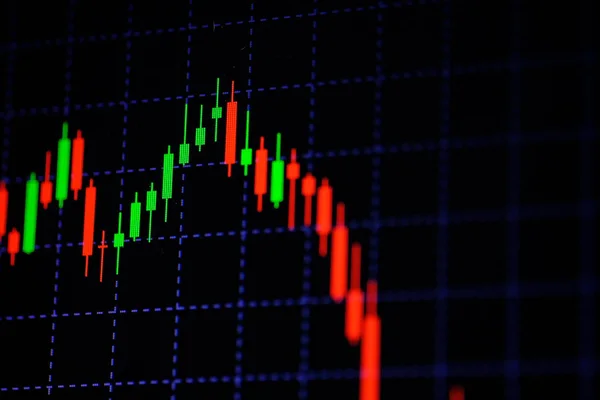
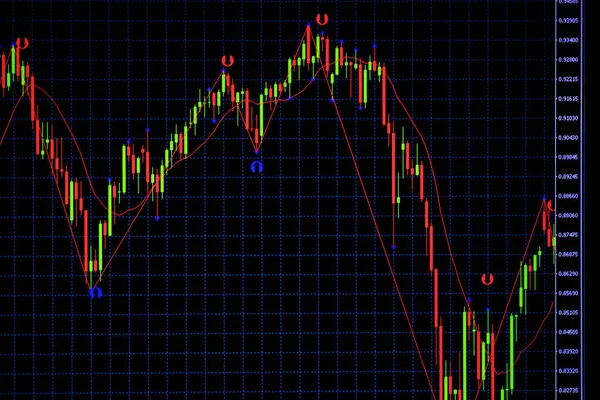
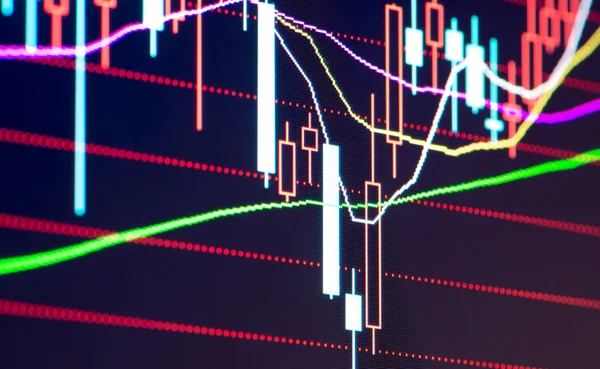
Candle Stick Graph Chart With Indicator Showing Bullish Point Or Bearish Point, Up Trend Or Down Trend Of Price Of Stock Market Or Stock Exchange Trading, Investment And Financial Concept. Thin Focus.
Image, 7.66MB, 6000 × 4000 jpg
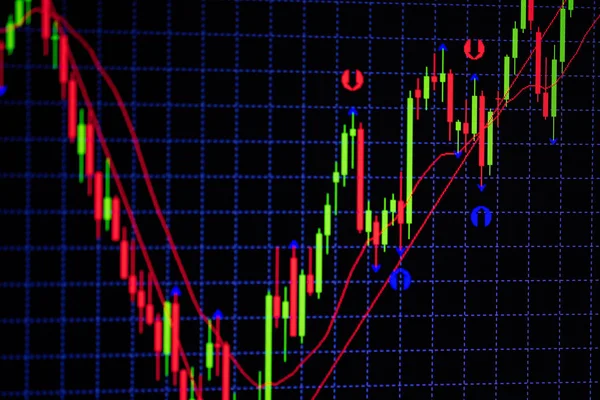


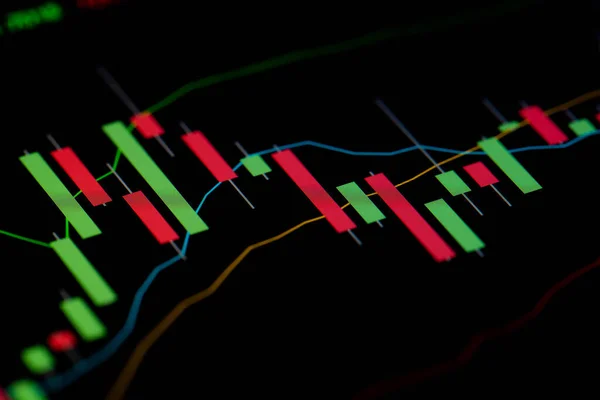
Candle Stick Graph Chart With Indicator Showing Bullish Point Or Bearish Point, Up Trend Or Down Trend Of Price Of Stock Market Or Stock Exchange Trading, Investment And Financial Concept.
Image, 8.07MB, 6000 × 4000 jpg

Red Graph On Smartphone With Blurry Computer Monitor Showing Stock Price Slump. The Concepts Of The Economic Downturn From Covid 19 And World Fuel Energy.
Image, 11.72MB, 6599 × 4399 jpg

Page 1 >> Next