
Stock image Macd

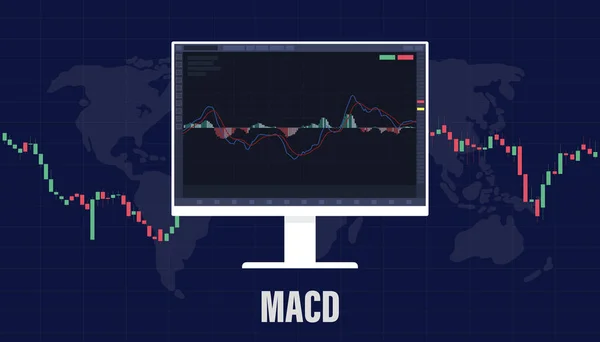
Macd Moving Average Convergence Divergence Indicator For Stock Market Trading With Big Screen And Candle Stick With Modern Flat Style Vector Illustration
Vector, 1.12MB, 7000 × 4000 eps


MACD - Moving Average Convergence Divergence Wooden Cubes With Letters On Laptop Keyboardwith Charts , Magnifier
Image, 4.06MB, 4564 × 2520 jpg
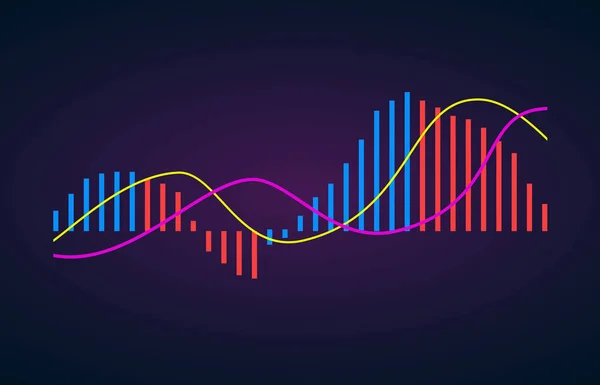
MACD Indicator Technical Analysis. Vector Stock And Cryptocurrency Exchange Graph, Forex Analytics And Trading Market Chart. Moving Average Convergence Divergence Flat Icon.
Vector, 2.89MB, 5000 × 3214 eps

MACD Indicator Technical Analysis. Stock Market And Cryptocurrency Exchange Graph, Forex Analytics And Trading Market Chart. Moving Average Convergence Divergence Flat Icon
Vector, 5.32MB, 5000 × 3214 eps

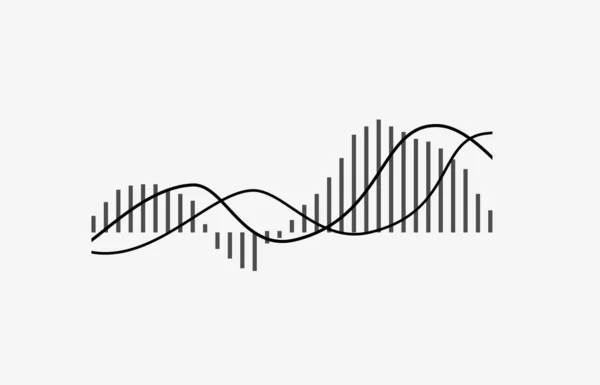
MACD Indicator Technical Analysis. Vector Stock And Cryptocurrency Exchange Graph, Forex Analytics And Trading Market Chart. Moving Average Convergence Divergence
Vector, 2.91MB, 5000 × 3214 eps

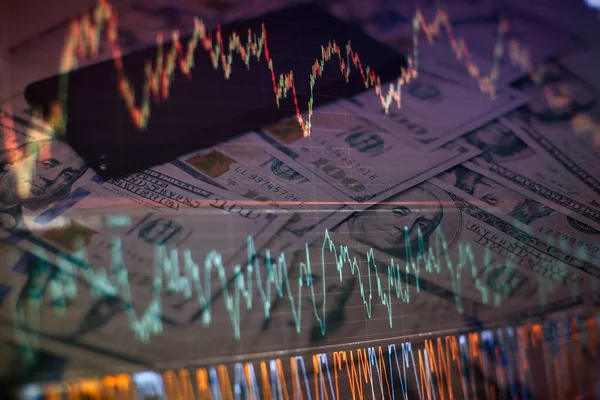
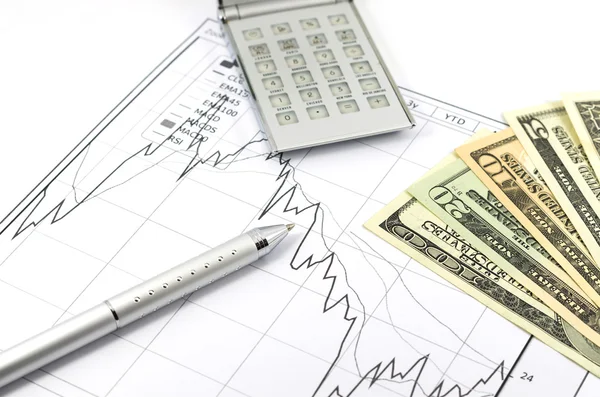
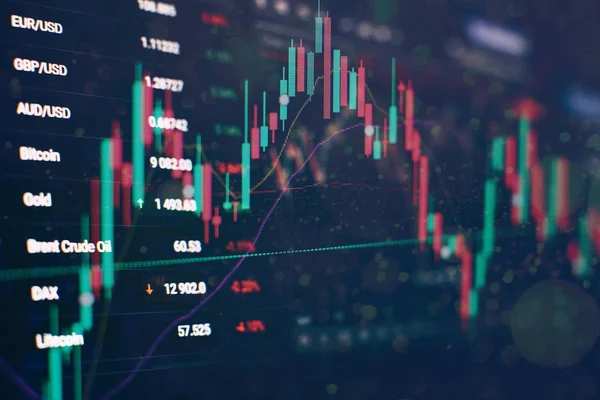
Trading On The Currency Market Forex. Currency Exchange Rate For World Currency: US Dollar, Euro, Frank, Yen. Financial, Money, Global Finance, Stock Market Background
Image, 7.6MB, 5472 × 3648 jpg
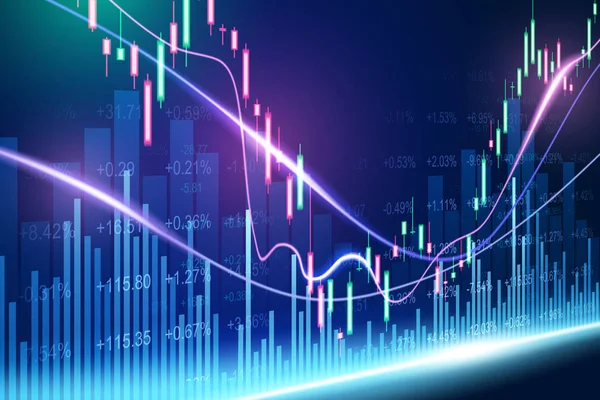
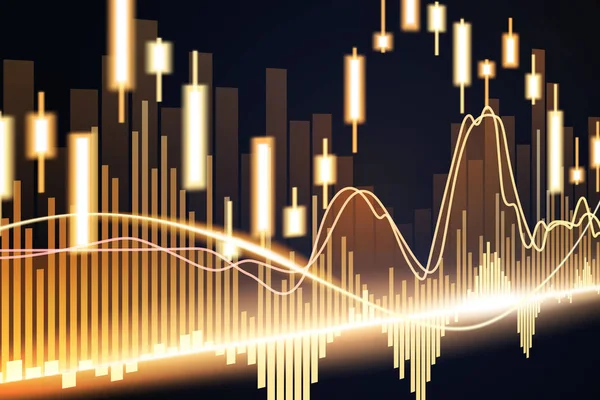
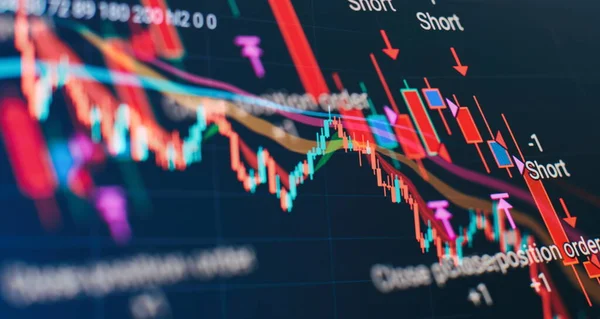
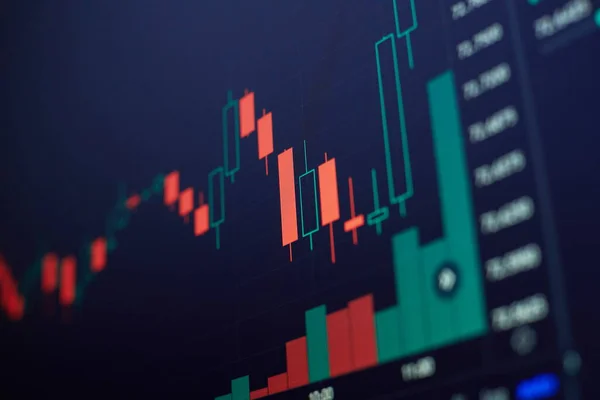
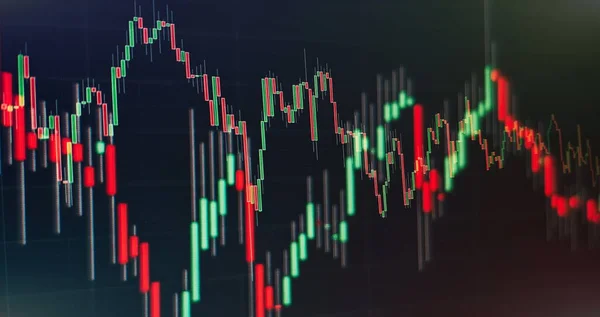
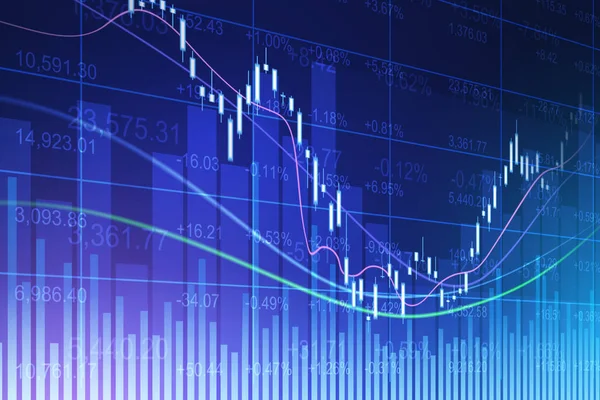
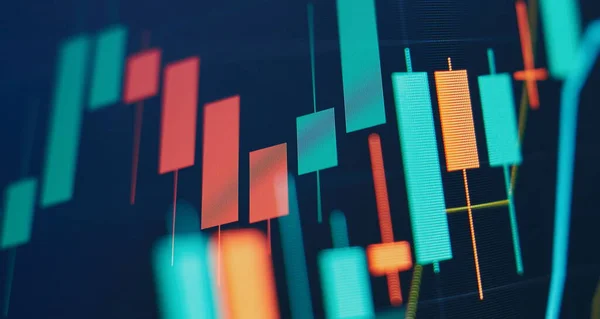
Technical Price Graph And Indicator, Red And Green Candlestick Chart On Blue Theme Screen, Market Volatility, Up And Down Trend. Stock Trading, Crypto Currency Background.
Image, 10.71MB, 5472 × 3648 jpg
"forex Trading Graph And Candlestick Chart Suitable For Financial Investment Concept. Economy Trends Background For Business Idea And All Art Work Design. Abstract Finance Background."
Image, 0MB, 8858 × 4724 jpg
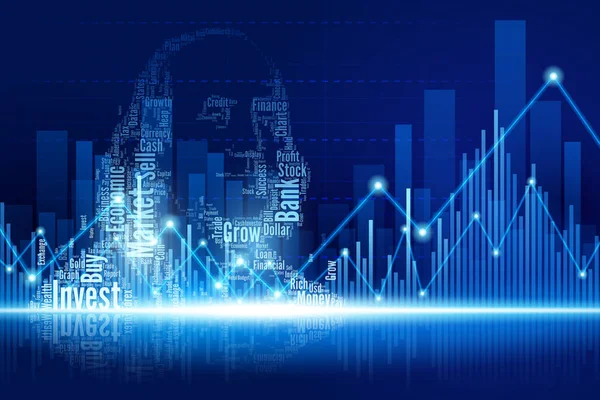
Business Success And Growth Concept.Stock Market Business Graph Chart On Digital Screen.Forex Market, Gold Market And Crude Oil Market .
Image, 3.41MB, 5472 × 3648 jpg

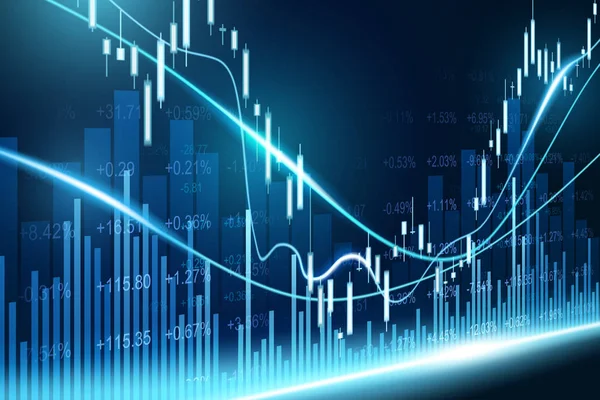
Economic Graph With Diagrams On The Stock Market, For Business And Financial Concepts
Image, 6.07MB, 10039 × 3543 jpg

Economy Trends Background For Business Idea And All Art Work Design. Abstract Finance Background. Business Success And Growth Concept.
Image, 10.98MB, 7677 × 4065 jpg

Technical Price Graph And Indicator, Red And Green Candlestick Chart On Blue Theme Screen, Market Volatility, Up And Down Trend. Stock Trading, Crypto Currency Background.
Image, 2.13MB, 5315 × 3543 jpg
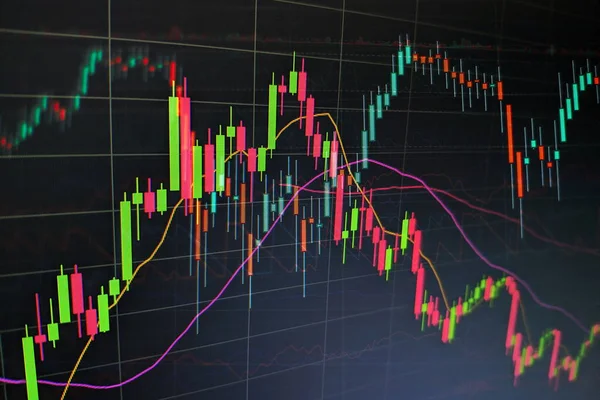
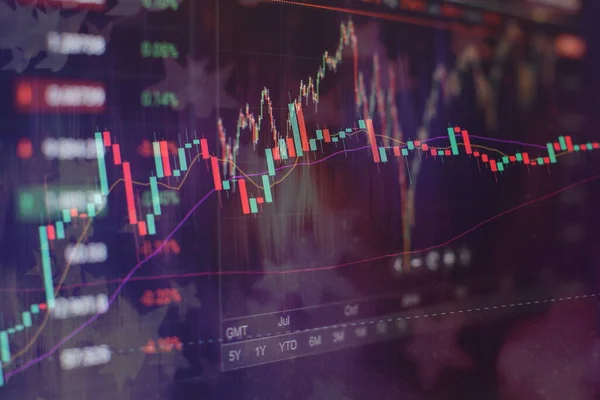
Charts Of Financial Instruments With Various Type Of Indicators Including Volume Analysis For Professional Technical Analysis On The Monitor Of A Computer.
Image, 5.84MB, 5315 × 3543 jpg
Charts Of Financial Instruments With Various Type Of Indicators Including Volume Analysis For Professional Technical Analysis On The Monitor Of A Computer.
Image, 5.94MB, 5315 × 3543 jpg

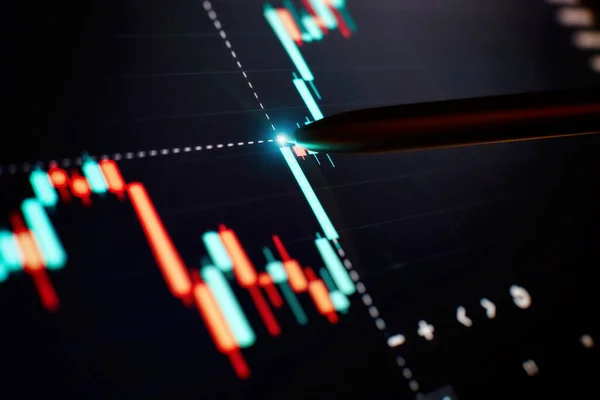
Technical Price Graph And Indicator, Red And Green Candlestick Chart On Blue Theme Screen, Market Volatility, Up And Down Trend. Stock Trading, Crypto Currency Background.
Image, 7.87MB, 5315 × 3543 jpg


The Business Plan At The Meeting And Analyze Financial Numbers To View The Performance Of The Company.
Image, 6.19MB, 5315 × 3543 jpg

Technical Price Graph And Indicator, Red And Green Candlestick Chart On Blue Theme Screen, Market Volatility, Up And Down Trend. Stock Trading, Crypto Currency Background.
Image, 4.09MB, 5472 × 3648 jpg
Technical Price Graph And Indicator, Red And Green Candlestick Chart On Blue Theme Screen, Market Volatility, Up And Down Trend. Stock Trading, Crypto Currency Background.
Image, 12.74MB, 10039 × 5315 jpg

Forex Trading Graph And Candlestick Chart Suitable For Financial Investment Concept. Economy Trends Background For Business Idea And All Art Work Design. Abstract Finance Background.
Image, 20.57MB, 8858 × 4724 jpg
Business Success And Growth Concept.Stock Market Business Graph Chart On Digital Screen.Forex Market, Gold Market And Crude Oil Market .
Image, 4.75MB, 5315 × 3543 jpg

Technical Price Graph And Indicator, Red And Green Candlestick Chart On Blue Theme Screen, Market Volatility, Up And Down Trend. Stock Trading, Crypto Currency Background.
Image, 5.65MB, 5472 × 3648 jpg

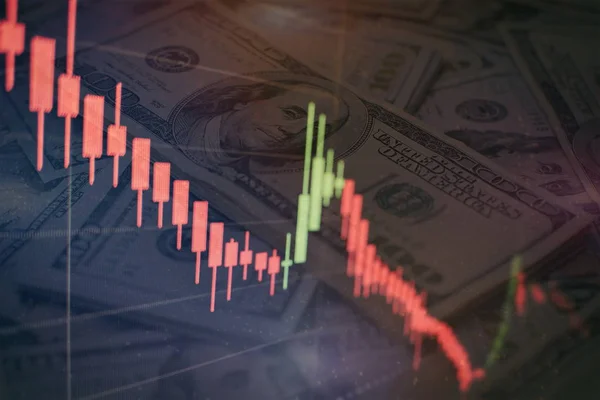
Trading On The Currency Market Forex. Currency Exchange Rate For World Currency: US Dollar, Euro, Frank, Yen. Financial, Money, Global Finance, Stock Market Background
Image, 8.72MB, 5315 × 3543 jpg

Technical Price Graph And Indicator, Red And Green Candlestick Chart On Blue Theme Screen, Market Volatility, Up And Down Trend. Stock Trading, Crypto Currency Background.
Image, 6.1MB, 5315 × 3543 jpg
Financial Chart With Pen, Stock Analysis Data For Business Background On Digital Screen. Graphs Of The Growth Of The Financial Market Forex. Trading Candlestick Chart
Image, 2.73MB, 5472 × 3648 jpg

Business Success And Growth Concept.Stock Market Business Graph Chart On Digital Screen.Forex Market, Gold Market And Crude Oil Market .
Image, 5.44MB, 5315 × 3543 jpg
MACD Indicator Technical Analysis. Vector Stock And Cryptocurrency Exchange Graph, Forex Analytics And Trading Market Chart. Moving Average Convergence Divergence.
Vector, 2.83MB, 5000 × 3214 eps

Technical Price Graph And Indicator, Red And Green Candlestick Chart On Blue Theme Screen, Market Volatility, Up And Down Trend. Stock Trading, Crypto Currency Background.
Image, 5.23MB, 5315 × 3543 jpg

Technical Price Graph And Indicator, Red And Green Candlestick Chart On Blue Theme Screen, Market Volatility, Up And Down Trend. Stock Trading, Crypto Currency Background.
Image, 11.42MB, 10039 × 5315 jpg
Technical Price Graph And Indicator, Red And Green Candlestick Chart On Blue Theme Screen, Market Volatility, Up And Down Trend. Stock Trading, Crypto Currency Background.
Image, 11.9MB, 8858 × 4724 jpg
Technical Price Graph And Indicator, Red And Green Candlestick Chart On Blue Theme Screen, Market Volatility, Up And Down Trend. Stock Trading, Crypto Currency Background.
Image, 6.5MB, 5315 × 3543 jpg

Trading On The Currency Market Forex. Currency Exchange Rate For World Currency: US Dollar, Euro, Frank, Yen. Financial, Money, Global Finance, Stock Market Background
Image, 7.27MB, 5472 × 3648 jpg

Technical Price Graph And Indicator, Red And Green Candlestick Chart On Blue Theme Screen, Market Volatility, Up And Down Trend. Stock Trading, Crypto Currency Background.
Image, 12.72MB, 5472 × 3648 jpg
Technical Price Graph And Indicator, Red And Green Candlestick Chart On Blue Theme Screen, Market Volatility, Up And Down Trend. Stock Trading, Crypto Currency Background.
Image, 5.44MB, 5472 × 3648 jpg

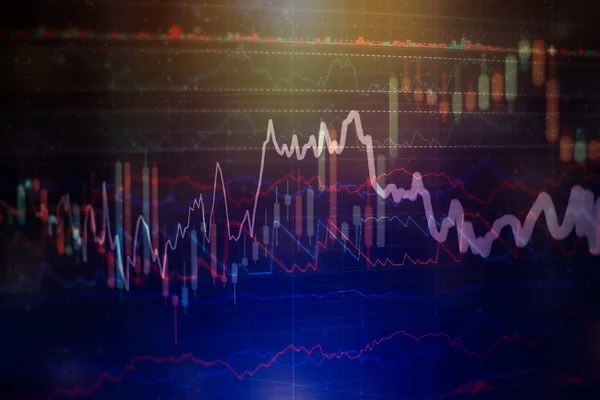
Blurry Growing Digital Graph Interface Over Dark Blue Background. Concept Of Stock Market And Financial
Image, 10.99MB, 8858 × 4724 jpg

Charts Of Financial Instruments With Various Type Of Indicators Including Volume Analysis For Professional Technical Analysis On The Monitor Of A Computer.
Image, 6.65MB, 5315 × 3543 jpg

Stock Index On The Computer Monitor . Financial Data On A Monitor Which Including Of Market Analyze. Bar Graphs, Diagrams, Financial Figures.
Image, 10.41MB, 8858 × 4724 jpg
Page 1 >> Next