
Stock image Oil Markets


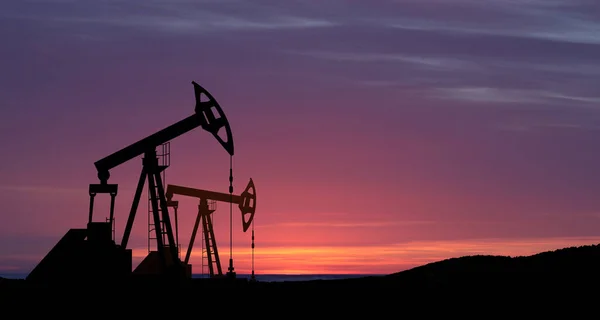
The Change In Oil Prices Caused By The War. Oil Prices Are Rising Because Of The Global Crisis. Oil Drilling Derricks At Desert Oilfield. Crude Oil Production From The Ground. Petroleum Production.
Image, 3.95MB, 5616 × 3000 jpg

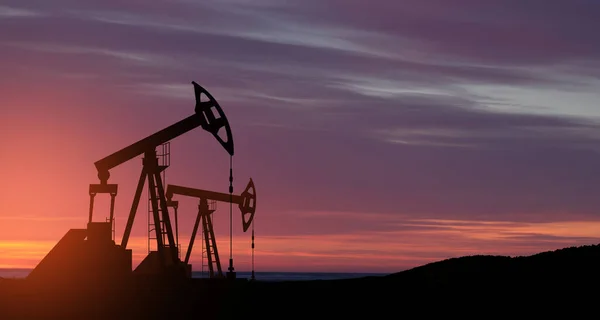
The Change In Oil Prices Caused By The War. Oil Prices Are Rising Because Of The Global Crisis. Oil Drilling Derricks At Desert Oilfield. Crude Oil Production From The Ground. Petroleum Production.
Image, 3.67MB, 5616 × 3000 jpg
The Change In Oil Prices Caused By The War. Oil Prices Are Rising Because Of The Global Crisis. Oil Drilling Derricks At Desert Oilfield. Crude Oil Production From The Ground. Petroleum Production.
Image, 3.94MB, 5616 × 3000 jpg
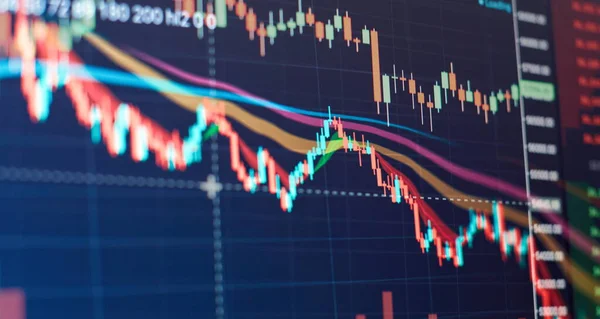
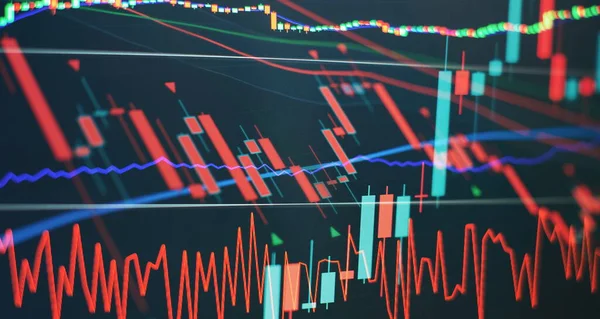
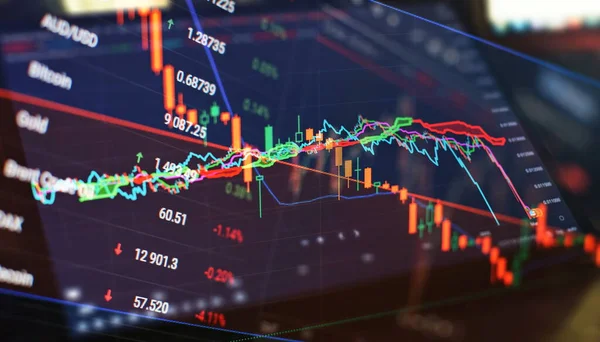
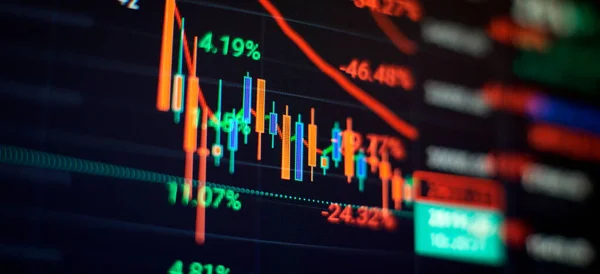
Technical Price Graph And Indicator, Red And Green Candlestick Chart On Blue Theme Screen, Market Volatility, Up And Down Trend. Stock Trading, Crypto Currency Background.
Image, 5.44MB, 5472 × 3648 jpg

The Change In Oil Prices Caused By The War. Oil Prices Are Rising Because Of The Global Crisis. Oil Drilling Derricks At Desert Oilfield. Crude Oil Production From The Ground. Petroleum Production.
Image, 3.98MB, 5616 × 3000 jpg

The Change In Oil Prices Caused By The War. Oil Price Cap Concept. Oil Drilling Derricks At Desert Oilfield. Crude Oil Production From The Ground. Petroleum Production.
Image, 7.18MB, 5616 × 3000 jpg

The Change In Oil Prices Caused By The War. Oil Prices Are Rising Because Of The Global Crisis. Oil Drilling Derricks At Desert Oilfield. Crude Oil Production From The Ground. Petroleum Production.
Image, 5.85MB, 5616 × 3000 jpg

The Change In Oil Prices Caused By The War. Oil Prices Are Rising Because Of The Global Crisis. Oil Drilling Derricks At Desert Oilfield. Crude Oil Production From The Ground. Petroleum Production.
Image, 4.79MB, 5616 × 3000 jpg

The Change In Oil Prices Caused By The War. Oil Prices Are Rising Because Of The Global Crisis. Oil Drilling Derricks At Desert Oilfield. Crude Oil Production From The Ground. Petroleum Production.
Image, 5.77MB, 5616 × 3000 jpg


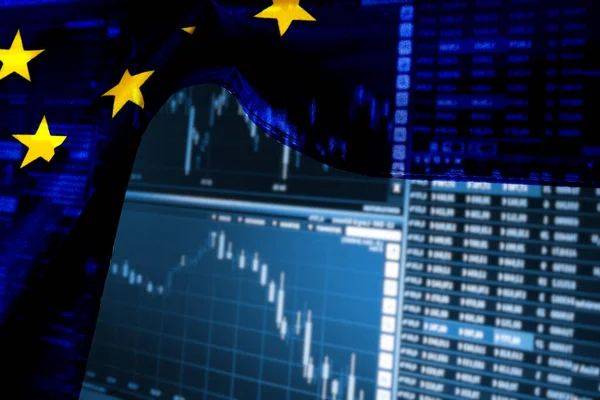
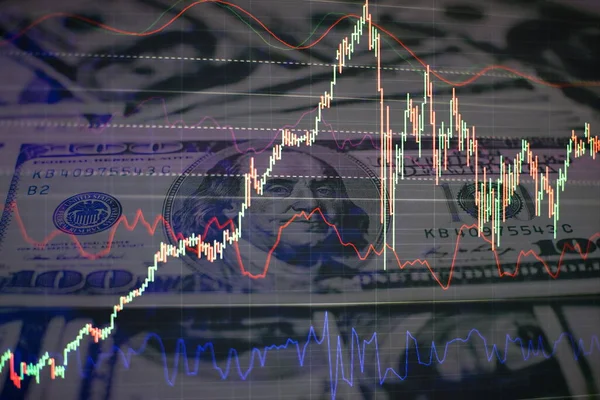
Forex Trading Graph And Candlestick Chart Suitable For Financial Investment Concept. Economy Trends Background For Business Idea And All Art Work Design. Abstract Finance Background.
Image, 15.94MB, 8858 × 4724 jpg

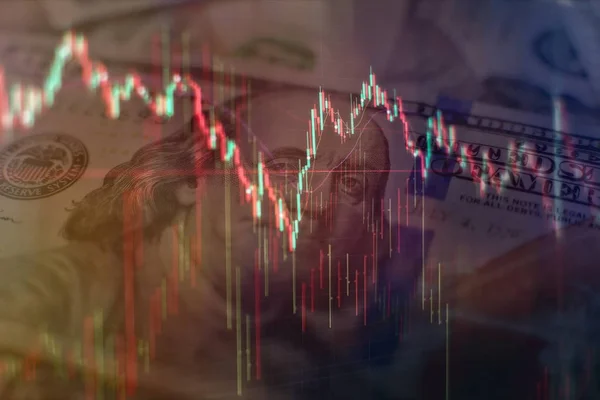
Financial Chart With Pen, Stock Analysis Data For Business Background On Digital Screen. Graphs Of The Growth Of The Financial Market Forex. Trading Candlestick Chart
Image, 6.6MB, 5472 × 3648 jpg

Blurry Growing Digital Graph Interface Over Dark Blue Background. Concept Of Stock Market And Financial
Image, 13.27MB, 8858 × 4724 jpg

Financial Chart With Pen, Stock Analysis Data For Business Background On Digital Screen. Graphs Of The Growth Of The Financial Market Forex. Trading Candlestick Chart
Image, 7.24MB, 5472 × 3648 jpg

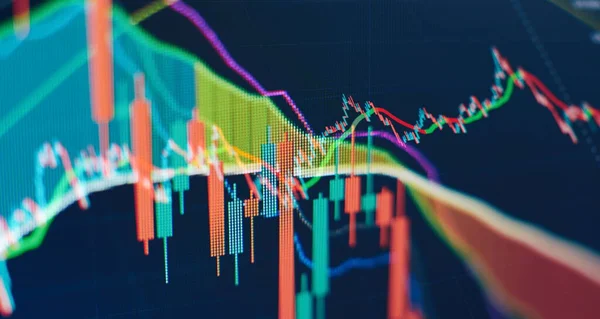
Charts Of Financial Instruments With Various Type Of Indicators Including Volume Analysis For Professional Technical Analysis On The Monitor Of A Computer.
Image, 17.25MB, 10039 × 5315 jpg
Technical Price Graph And Indicator, Red And Green Candlestick Chart On Blue Theme Screen, Market Volatility, Up And Down Trend. Stock Trading, Crypto Currency Background.
Image, 18.38MB, 8858 × 4724 jpg

Digital Graph Interface Over Dark Blue Background. Concept Of Stock Market And Financial Success.
Image, 4.83MB, 8858 × 4724 jpg
Technical Price Graph And Indicator, Red And Green Candlestick Chart On Blue Theme Screen, Market Volatility, Up And Down Trend. Stock Trading, Crypto Currency Background.
Image, 11.87MB, 8268 × 4724 jpg
Technical Price Graph And Indicator, Red And Green Candlestick Chart On Blue Theme Screen, Market Volatility, Up And Down Trend. Stock Trading, Crypto Currency Background.
Image, 7.54MB, 5315 × 3543 jpg

Charts Of Financial Instruments With Various Type Of Indicators Including Volume Analysis For Professional Technical Analysis On The Monitor Of A Computer.
Image, 7.22MB, 5315 × 3543 jpg

Financial Chart With Pen, Stock Analysis Data For Business Background On Digital Screen. Graphs Of The Growth Of The Financial Market Forex. Trading Candlestick Chart
Image, 5.69MB, 5472 × 3648 jpg

Technical Price Graph And Indicator, Red And Green Candlestick Chart On Blue Theme Screen, Market Volatility, Up And Down Trend. Stock Trading, Crypto Currency Background.
Image, 25.16MB, 10039 × 5315 jpg

Economy Trends Background For Business Idea And All Art Work Design. Abstract Finance Background. Business Success And Growth Concept.
Image, 10.98MB, 7677 × 4065 jpg

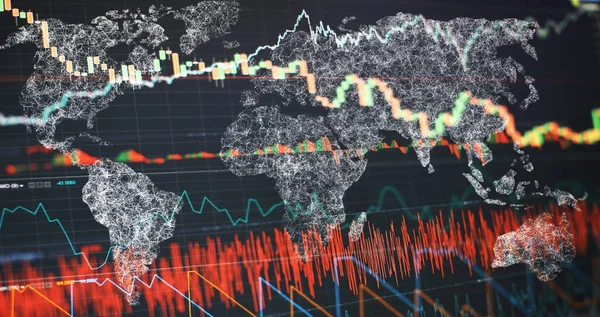
Economic Graph With Diagrams On The Stock Market, For Business And Financial Concepts
Image, 26.56MB, 8858 × 4724 jpg

Economic Graph With Diagrams On The Stock Market, For Business And Financial Concepts
Image, 21.07MB, 8858 × 4724 jpg

Economic Graph With Diagrams On The Stock Market, For Business And Financial Concepts
Image, 14.29MB, 8858 × 4724 jpg

Technical Price Graph And Indicator, Red And Green Candlestick Chart On Blue Theme Screen, Market Volatility, Up And Down Trend. Stock Trading, Crypto Currency Background.
Image, 16.75MB, 8858 × 4724 jpg
Forex Trading Graph And Candlestick Chart Suitable For Financial Investment Concept. Economy Trends Background For Business Idea And All Art Work Design. Abstract Finance Background.
Image, 15.07MB, 8858 × 4724 jpg

Technical Price Graph And Indicator, Red And Green Candlestick Chart On Blue Theme Screen, Market Volatility, Up And Down Trend. Stock Trading, Crypto Currency Background.
Image, 18.88MB, 8858 × 4724 jpg

Technical Price Graph And Indicator, Red And Green Candlestick Chart On Blue Theme Screen, Market Volatility, Up And Down Trend. Stock Trading, Crypto Currency Background.
Image, 16.36MB, 8858 × 4724 jpg

Charts Of Financial Instruments With Various Type Of Indicators Including Volume Analysis For Professional Technical Analysis On The Monitor Of A Computer.
Image, 5.23MB, 5315 × 3543 jpg

Technical Price Graph And Indicator, Red And Green Candlestick Chart On Blue Theme Screen, Market Volatility, Up And Down Trend. Stock Trading, Crypto Currency Background.
Image, 3.58MB, 5472 × 3648 jpg

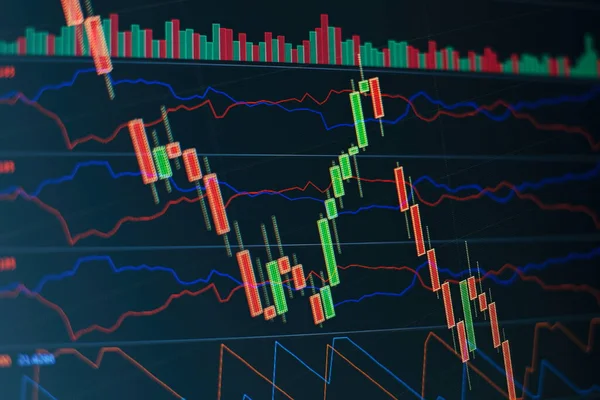
Graph And Indicator, Red And Green Candlestick Chart On Blue Theme Screen, Market Volatility, Up And Down Trend. Stock Trading, Crypto Currency Background.
Image, 6.42MB, 8858 × 4724 jpg

Technical Price Graph And Indicator, Red And Green Candlestick Chart On Blue Theme Screen, Market Volatility, Up And Down Trend. Stock Trading, Crypto Currency Background.
Image, 8.1MB, 5472 × 3648 jpg

Technical Price Graph And Indicator, Red And Green Candlestick Chart On Blue Theme Screen, Market Volatility, Up And Down Trend. Stock Trading, Crypto Currency Background.
Image, 5.65MB, 5472 × 3648 jpg

Stock Trading, Crypto Currency Background.Charts Of Financial Instruments
Image, 21.68MB, 9803 × 4488 jpg
Technical Price Graph And Indicator, Red And Green Candlestick Chart On Blue Theme Screen, Market Volatility, Up And Down Trend. Stock Trading, Crypto Currency Background.
Image, 9.5MB, 5315 × 3543 jpg

Technical Price Graph And Indicator, Red And Green Candlestick Chart On Blue Theme Screen, Market Volatility, Up And Down Trend. Stock Trading, Crypto Currency Background.
Image, 3.37MB, 5472 × 3648 jpg
Technical Price Graph And Indicator, Red And Green Candlestick Chart On Blue Theme Screen
Image, 17.51MB, 9803 × 4488 jpg

Technical Price Graph And Indicator, Red And Green Candlestick Chart On Blue Theme Screen, Market Volatility, Up And Down Trend. Stock Trading, Crypto Currency Background.
Image, 12.65MB, 7680 × 4320 jpg

Charts Of Financial Instruments With Various Type Of Indicators Including Volume Analysis For Professional Technical Analysis On The Monitor Of A Computer.
Image, 4.59MB, 5315 × 3543 jpg
Economy Trends Background For Business Idea And All Art Work Design. Abstract Finance Background. Business Success And Growth Concept.
Image, 20.85MB, 10039 × 5315 jpg
Page 1 >> Next