
Stock image Plasma Cell page 3
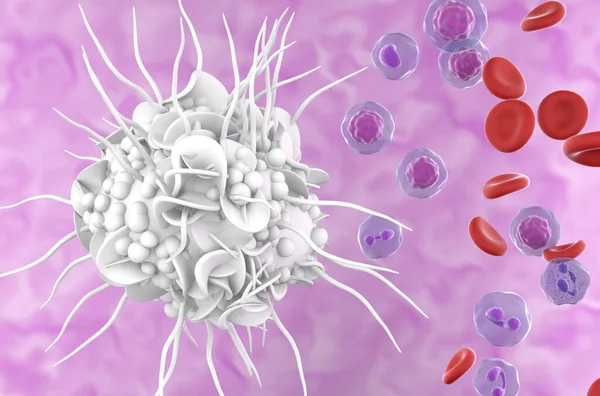
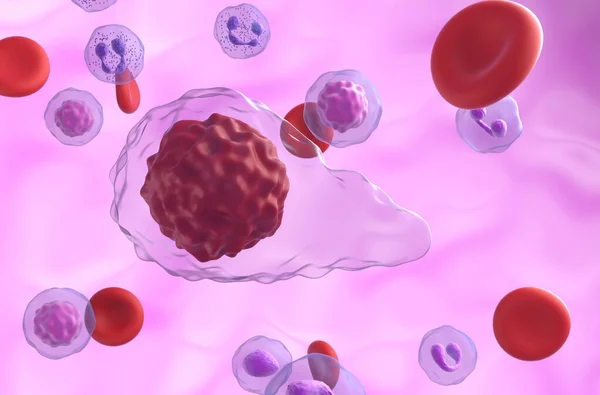
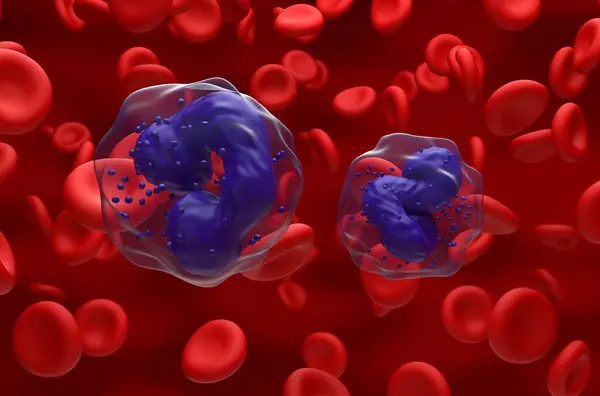
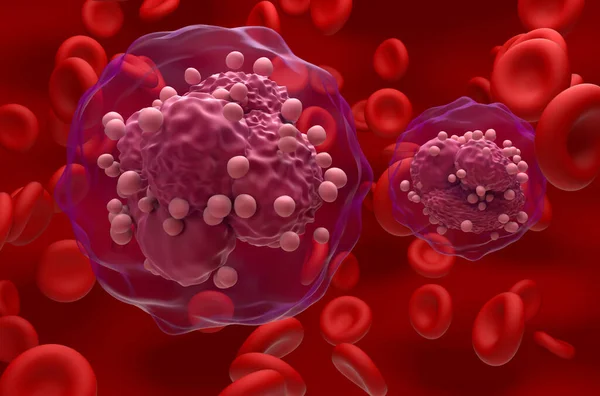
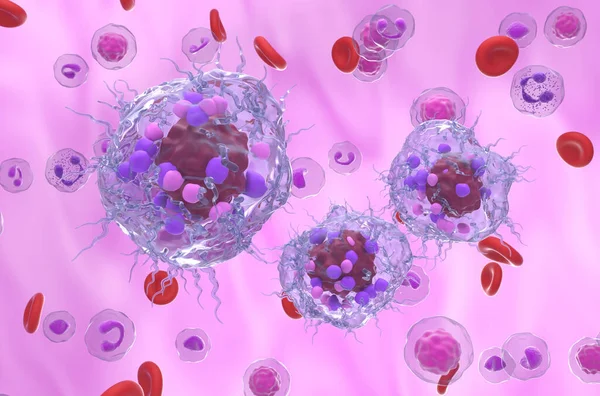
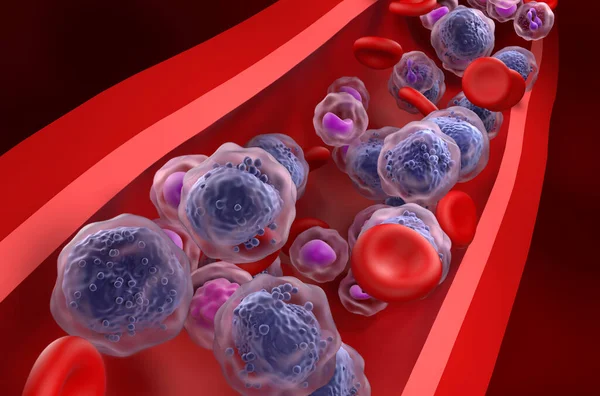
Non-hodgkin Lymphoma (NHL) Cells In The Blood Flow - Closeup View 3d Illustration
Image, 6.81MB, 10000 × 6600 jpg
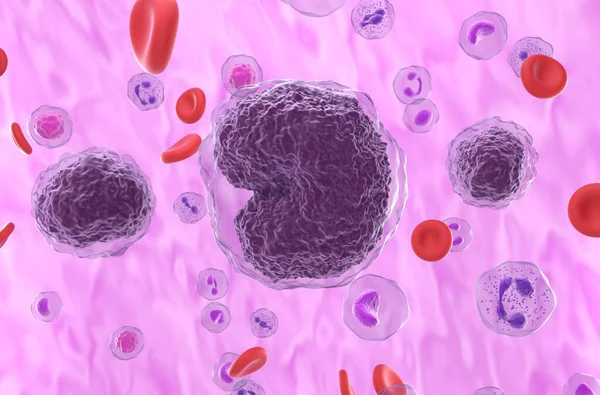
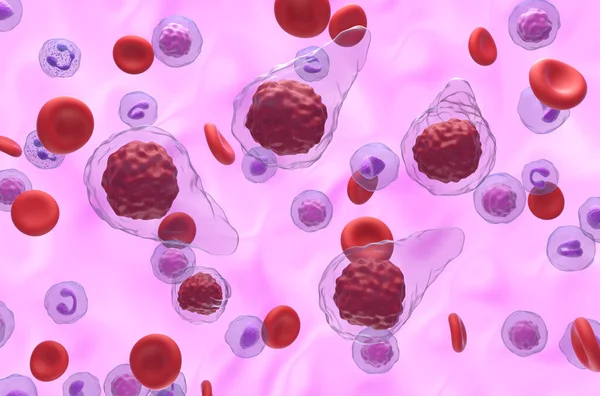
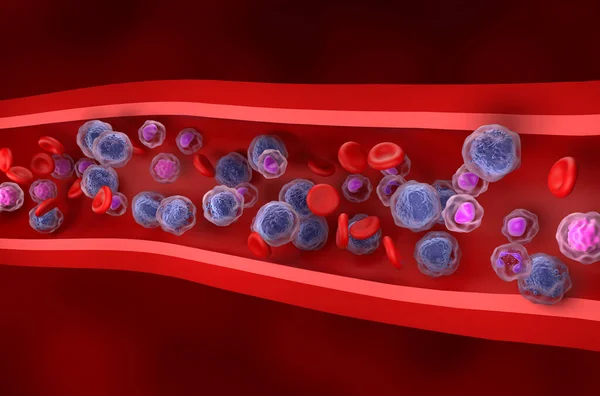
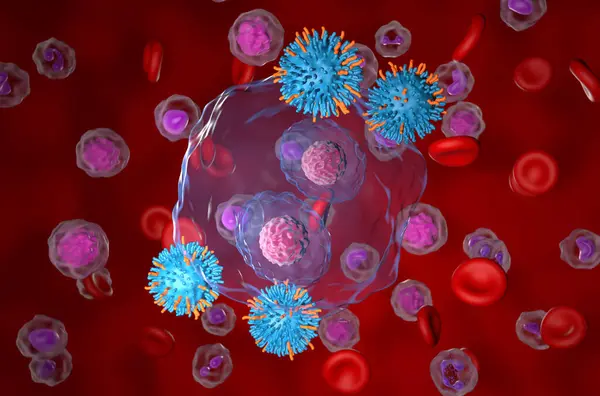
Chronic Lymphocytic Leukemia (CLL) Cells In Blood Flow - Isometric View 3d Illustration
Image, 4.62MB, 10000 × 6600 jpg
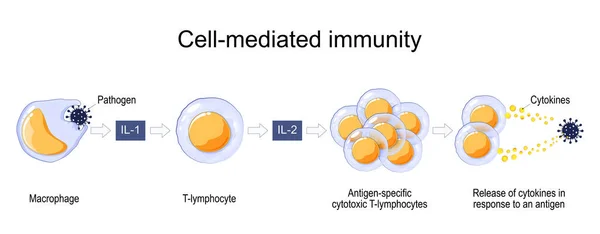
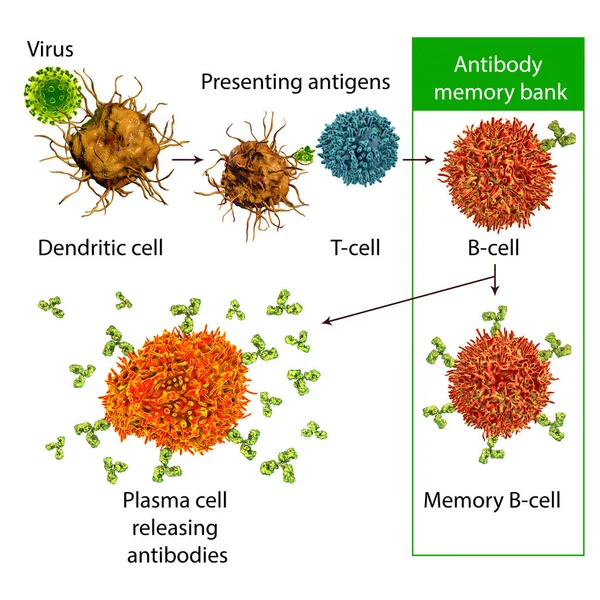
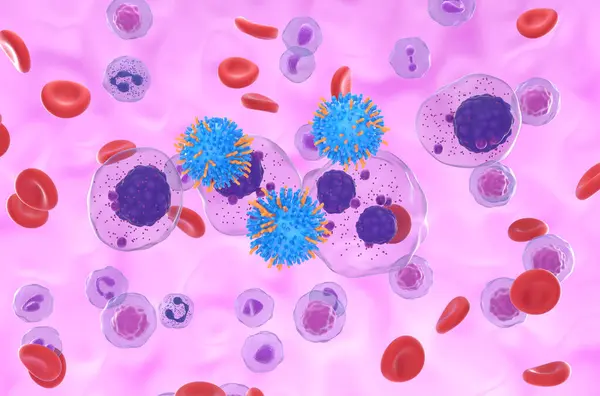
Immune Response. Cell-mediated Immunity. Activation Of Phagocytes, Antigen-specific Cytotoxic T-lymphocytes, And The Release Of Cytokines In Response To An Antigen. Vector Poster For Educatio
Vector, 11.15MB, 7000 × 2734 eps

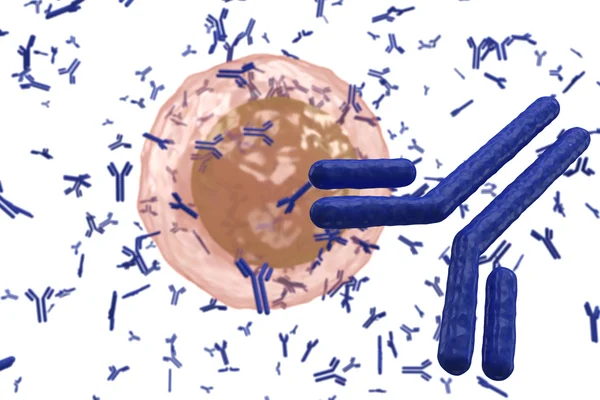
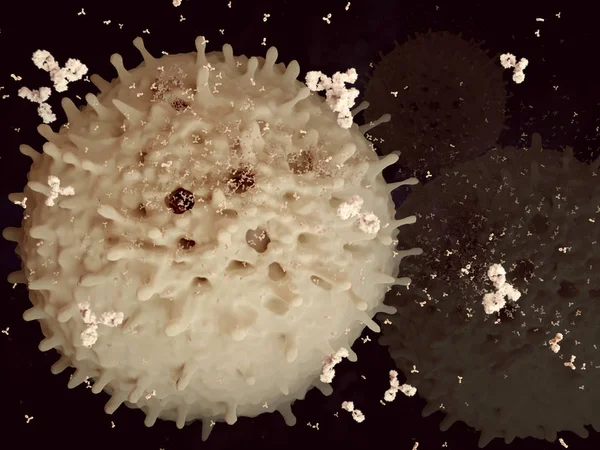
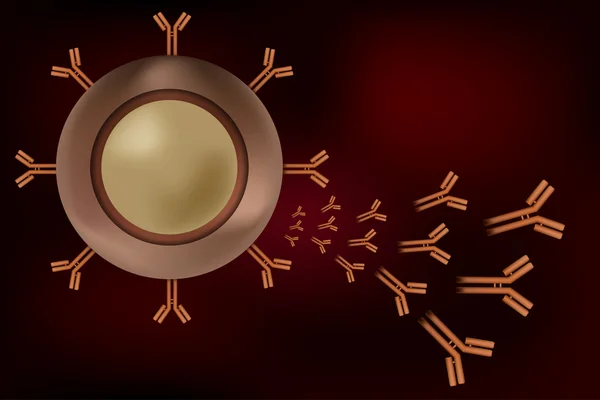
Plasma Cells (B-cells) Segregate Antibodies To Mark To Mark An Subsequently Destroy Viruses (influenza Viruses).
Image, 7.85MB, 8000 × 6000 jpg

IgA Immunity. Peyers Patch. Lymphoid Follicles Of The Small Intestine Generate IgA Immune Response With B Cells, T Cells, Dendritic Cells, And Plasma Cells Secreting IgA.
Vector, 6.98MB, 6250 × 5305 eps
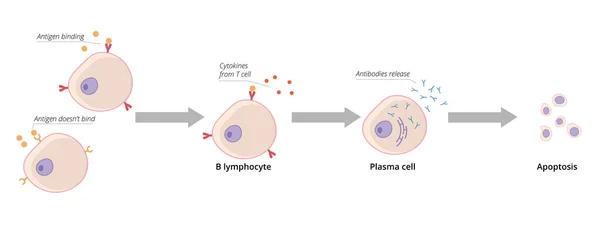
Detailed Scheme Of B Cell Activation. Mature B Cell Encounters Antigen That Binds To Its B Cell Receptor And It Becomes Activated
Vector, 5.91MB, 8333 × 3125 eps
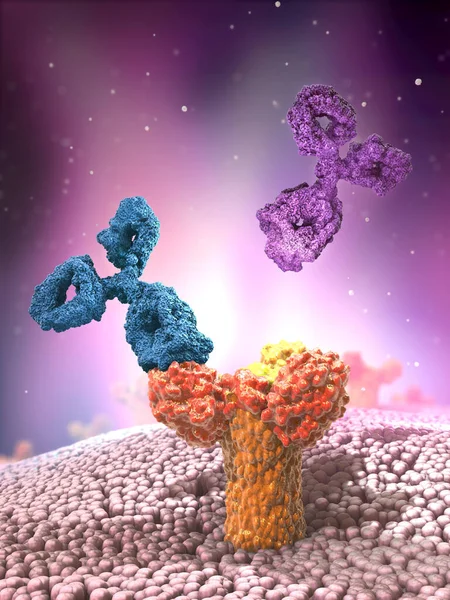
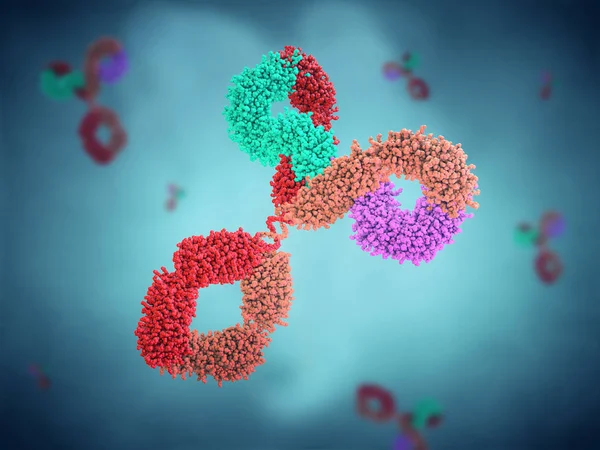
Multicolored Antibodies Or Immunoglobulin Protein Structures Attached To Receptor- 3d Illustration
Image, 27.17MB, 6000 × 8000 jpg
Plasma Cells Are White Blood Cells. They Produce And Segregate Antibodies.
Image, 3.15MB, 4000 × 3000 jpg
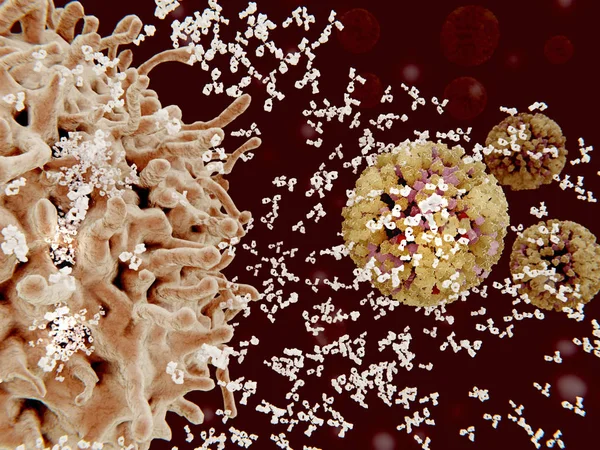
Plasma Cells (B-cells) Segregate Specific Antibodies To Mark An Subsequently Destroy Viruses (influenza Viruses).3D Rendering. Illustration
Image, 9.74MB, 8000 × 6000 jpg
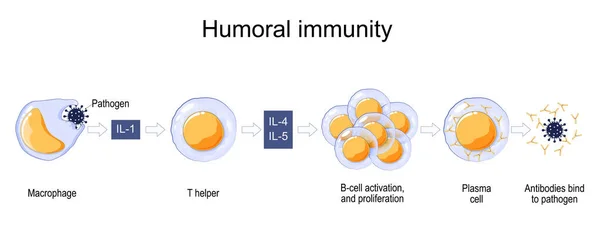
Immune Response. Humoral Immunity. Antibody-mediated Immunity. Activation Of Macrophage, B-cell And Plasma Cell. Antibodies Bind To Pathogen. Vector Poster For Education
Vector, 8.9MB, 7000 × 2638 eps

Multicolored Antibodies Or Immunoglobulin Protein Structures - 3d Illustration
Image, 15.34MB, 8000 × 3600 jpg


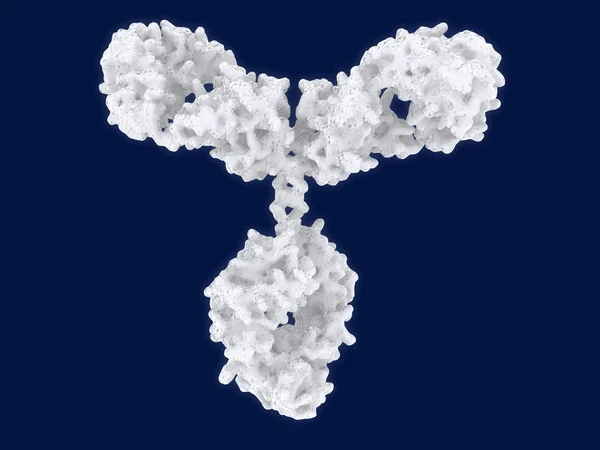
Antibody. Antibodies Are Proteins Produced By Plasma Cells. They Identify And Neutralize Bacteria And Viruses. Antibodies Recognize Unique Molecules Of The Pathogen, Called Antigens. 3d Rendering. Illustration
Image, 3.09MB, 4000 × 3000 jpg
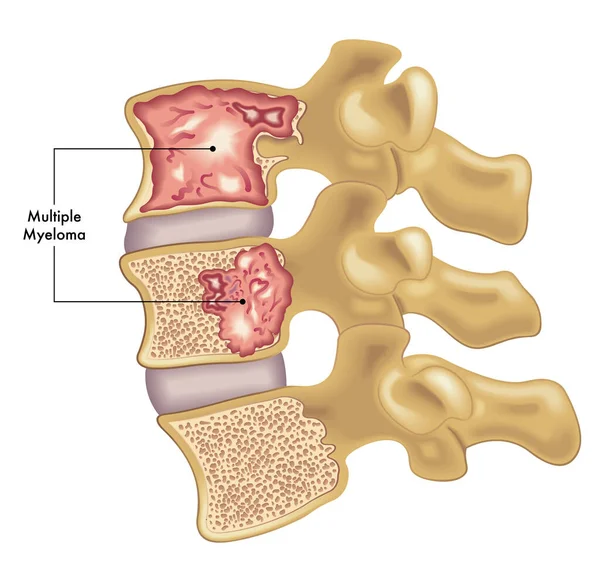
Medical Illustration Of Two Vertebrae Of The Spine Affected By Multiple Myeloma.
Vector, 4.87MB, 7087 × 6732 eps
Antibody. Antibodies Are Proteins Produced By Plasma Cells. They Identify And Neutralize Bacteria And Viruses. Antibodies Recognize Unique Molecules Of The Pathogen, Called Antigens. 3d Rendering. Illustration
Image, 1.2MB, 4000 × 3000 jpg

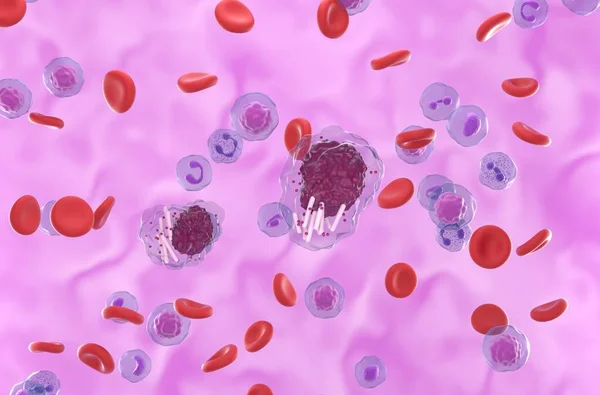
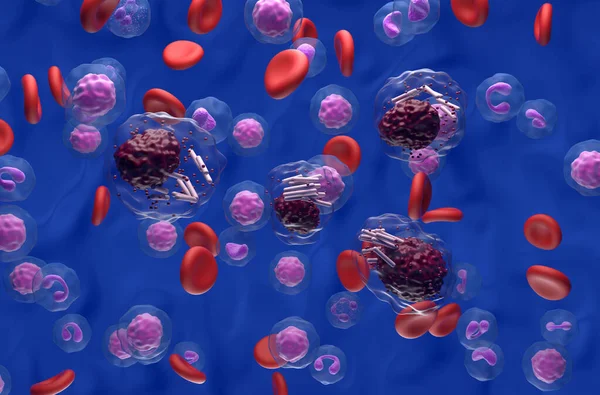
Primary Myelofibrosis (PMF) Cells In Blood Flow - Closeup View 3d Illustration
Image, 6.32MB, 10000 × 6600 jpg
Primary Myelofibrosis (PMF) Cells In Blood Flow - Isometric View 3d Illustration
Image, 7.02MB, 10000 × 6600 jpg
Acute Myeloid Leukemia (AML) Cells In Blood Flow - Section View 3d Illustration
Image, 7.29MB, 10000 × 6600 jpg
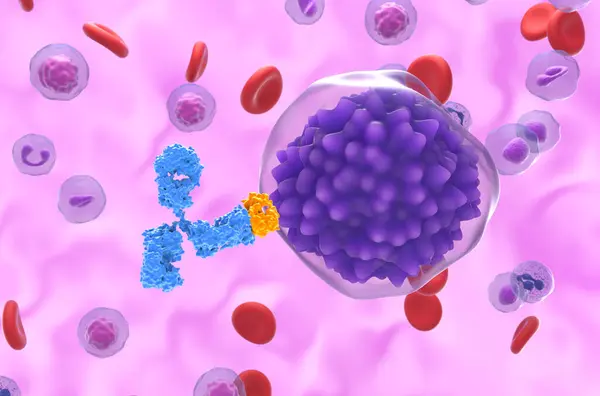
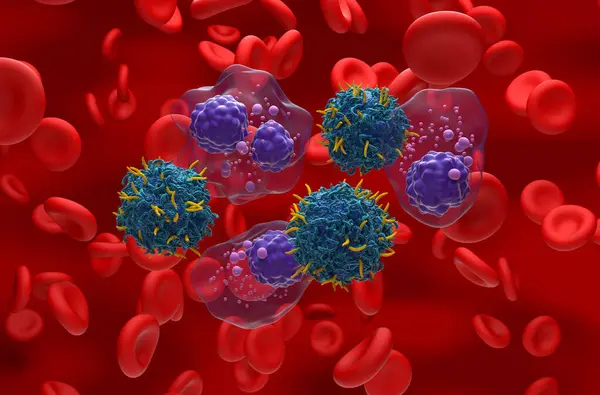
Monoclonal Antibody Treatment In Plasma Cell Leukemia (PCL) - Closeup View 3d Illustration
Image, 4.81MB, 10000 × 6600 jpg
Chronic Myelogenous Leukemia (CML) Cells In The Blood Flow - Closeup View 3d Illustration
Image, 8.05MB, 10000 × 6600 jpg
CAR T Cell Therapy In Multiple Myeloma (MM) - Isometric View 3d Illustration
Image, 7.7MB, 10000 × 6600 jpg
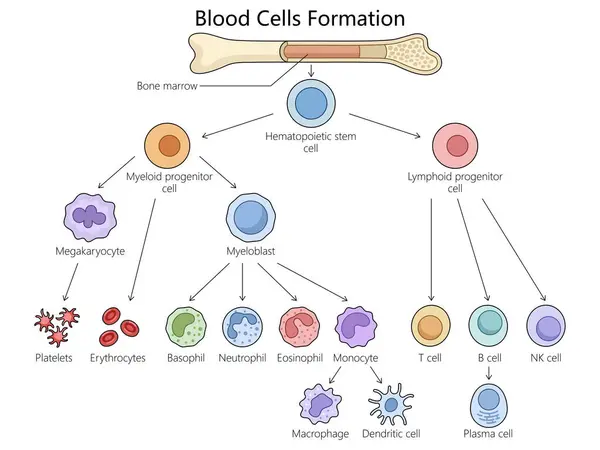
Human Hematopoiesis Blood Cell Formation From Bone Marrow, Hematopoietic Stem Cells Differentiation Structure Diagram Hand Drawn Schematic Raster Illustration. Medical Science Educational Illustration
Image, 3.18MB, 6000 × 4500 jpg
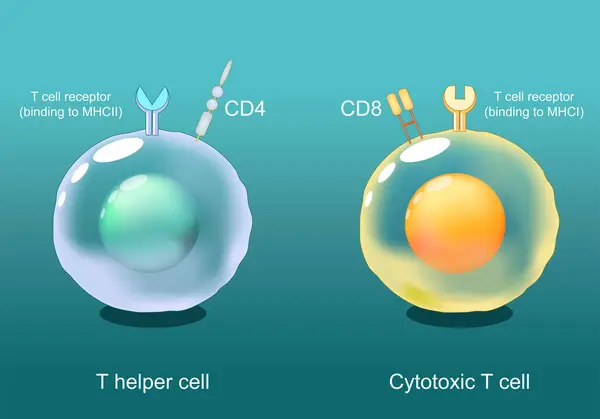
Helper T Cells And Cytotoxic T-cells. CD8 And CD4 Lymphocytes. Antigen Presentation. TCR Receptor On White Blood Cells. Adaptive Immune Response. Vector Illustration
Vector, 9.09MB, 11801 × 8257 eps

Human Hematopoiesis Blood Cell Formation From Bone Marrow, Hematopoietic Stem Cells Differentiation Structure Diagram Hand Drawn Schematic Vector Illustration. Medical Science Educational Illustration
Vector, 0.79MB, 5000 × 3750 eps
Acute Lymphoblastic Leukemia (ALL) Cancer Cells In The Blood Flow - Closeup View 3d Illustration
Image, 7.21MB, 10000 × 6600 jpg

CAR T Cell Therapy In Non-hodgkin Lymphoma (NHL) - Isometric View 3d Illustration
Image, 9.16MB, 10000 × 6600 jpg

Diffuse Large B-cell Lymphoma (DLBCL) - Closeup View 3d Illustration
Image, 5.62MB, 10000 × 6600 jpg

CAR T Cell Therapy In Diffuse Large B-cell Lymphoma (DLBCL) - Isometric View 3d Illustration
Image, 7.42MB, 10000 × 6600 jpg

CAR T Cell Therapy In Non-hodgkin Lymphoma (NHL) - Closeup View 3d Illustration
Image, 6.7MB, 10000 × 6600 jpg
Acute Myeloid Leukemia (AML) Cells In Blood Flow - Isometric View 3d Illustration
Image, 7.01MB, 10000 × 6600 jpg
CAR T Cell Therapy In Multiple Myeloma (MM) - Isometric View 3d Illustration
Image, 8.44MB, 10000 × 6600 jpg

Metastatic Neuroendocrine Tumor Cells In The Blood Flow - 3d Illustration Isometric View
Image, 8.46MB, 10000 × 6600 jpg

Reed-Sternberg Cell In Hodgkin Lymphoma Closeup View 3d Render Illustration
Image, 8.79MB, 10000 × 6600 jpg
Acute Myeloid Leukemia (AML) Cells In Blood Flow - Closeup View 3d Illustration
Image, 7.53MB, 10000 × 6600 jpg

B-cell Leukocyte Activation By Antigen. From Antigen Binding To B Cell Receptor, And Chemical Signal Of T-cell Helper To Becomes Plasma Cell And Antibodies Releases. White Blood Cell. Vector Illustration
Vector, 5.19MB, 11801 × 8257 eps
CAR T Cell Therapy In Hodgkin Lymphoma (HL) - Closeup View 3d Illustration
Image, 7.74MB, 10000 × 6600 jpg
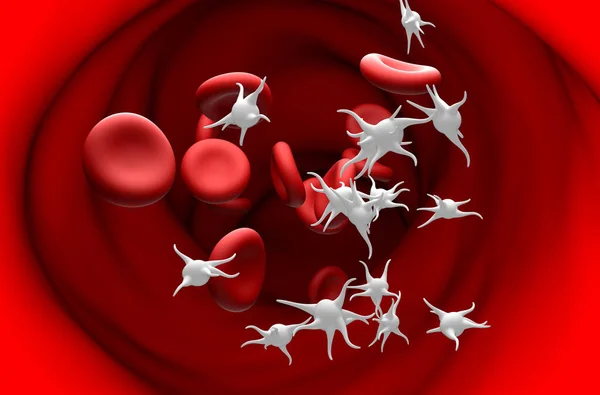
Essential Thrombocythemia (ET), Overproduction Of Platelets (thrombocytes) - Section View 3d Illustration
Image, 4.03MB, 10000 × 6600 jpg

CAR T Cell Therapy In Diffuse Large B-cell Lymphoma (DLBCL) - Closeup View 3d Illustration
Image, 6.95MB, 10000 × 6600 jpg
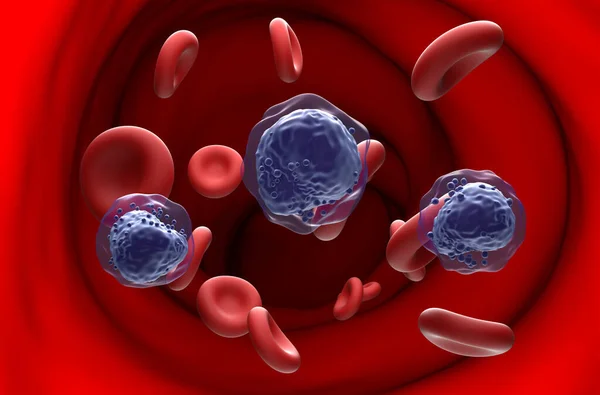
Chronic Lymphocytic Leukemia (CLL) Cells In Blood Flow - Isometric View 3d Illustration
Image, 8.21MB, 10000 × 6600 jpg
Abnormal Plasma Cell Or B-cell In Multiple Myeloma Emitting Paraprotein 3d Illustration
Image, 5.17MB, 10000 × 6600 jpg

Monoclonal Antibody Treatment In Prostate Cancer - Closeup View 3d Illustration
Image, 6.45MB, 10000 × 6600 jpg

CAR T Cell Therapy In Acute Myeloid Leukaemia (AML) - Isometric View 3d Illustration
Image, 7.94MB, 10000 × 6600 jpg
Previous << Page 3 >> Next