
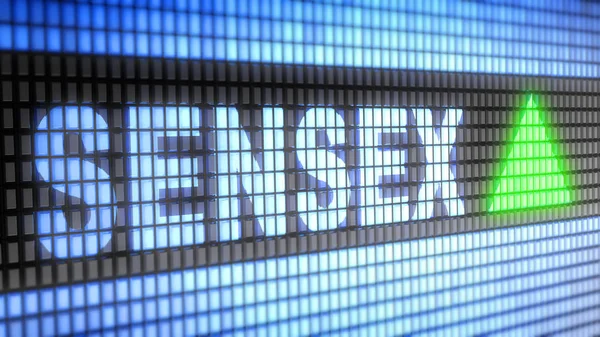
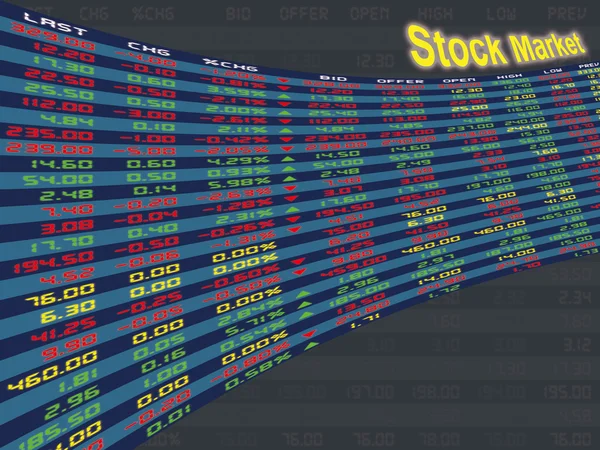
Stock image Sensex page 2
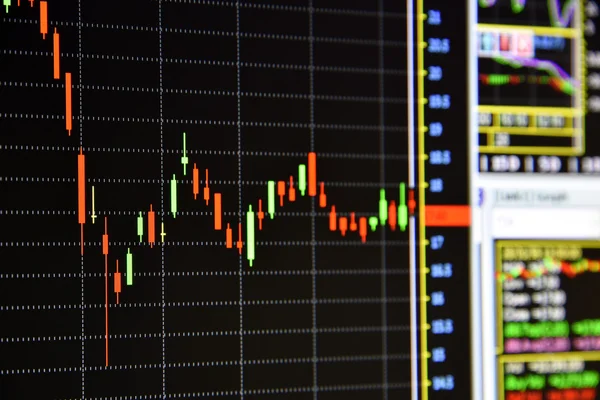
Analysis For Professional Technical Analysis On The Monitor Of A Computer. Fundamental And Technical Analysis Concept.
Image, 19.44MB, 8268 × 4488 jpg

The Bombay Stock Exchange (BSE) Is An Indian Stock Exchange Located At Dalal Street, Kala Ghoda, Mumbai (formerly Bombay), Maharashtra, India.
Image, 6.16MB, 6500 × 3656 jpg

BSE Building Bombay Stock Exchange BSE Stock Market Trading Indian Businesses Vector Illustration
Vector, 2.47MB, 10000 × 8000 eps


Analysis For Professional Technical Analysis On The Monitor Of A Computer.
Image, 7.21MB, 5472 × 3648 jpg

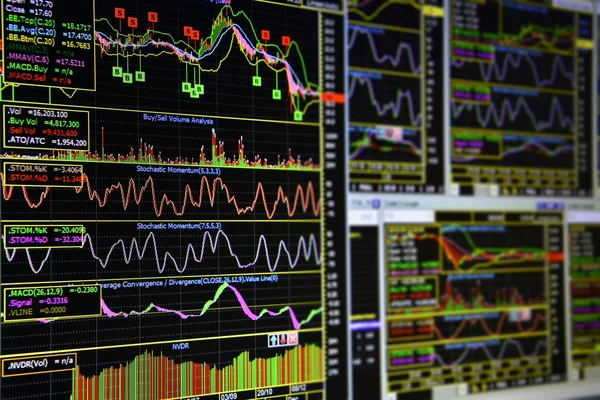
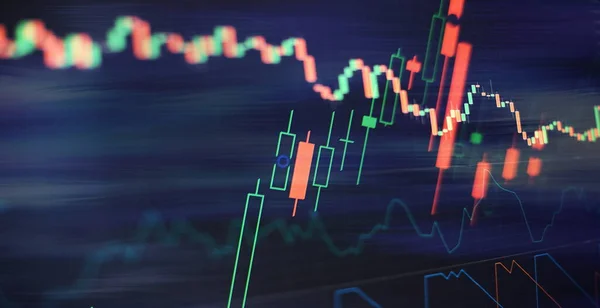
Financial Instruments With Various Type Of Indicators Including Volume Analysis For Professional Technical Analysis
Image, 11.28MB, 8858 × 4724 jpg
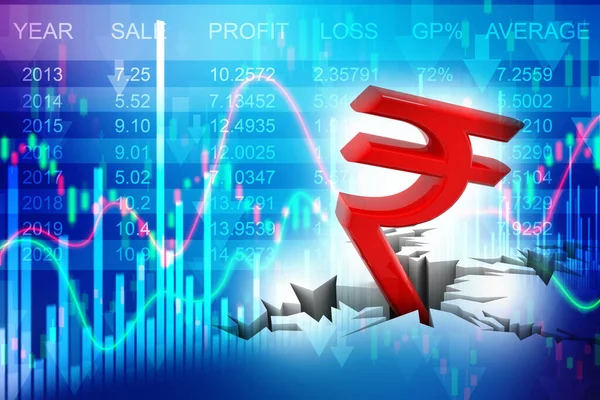
Indian Rupee Crisis Concept, Red Indian Rupee Symbol Down To Ground. 3D Rendering Isolated On Stock Market Background
Image, 3.05MB, 3600 × 2400 jpg

Analysis Business Accounting On Info Sheets. Businessman Hand Working On Analyzing Investment Charts For Gold Market, Forex Market And Trading Market.
Image, 6.04MB, 5315 × 3543 jpg


Indicators Including Volume Analysis For Professional Technical Analysis On The Monitor Of A Computer. Fundamental And Technical Analysis Concept.
Image, 2.75MB, 5315 × 3543 jpg


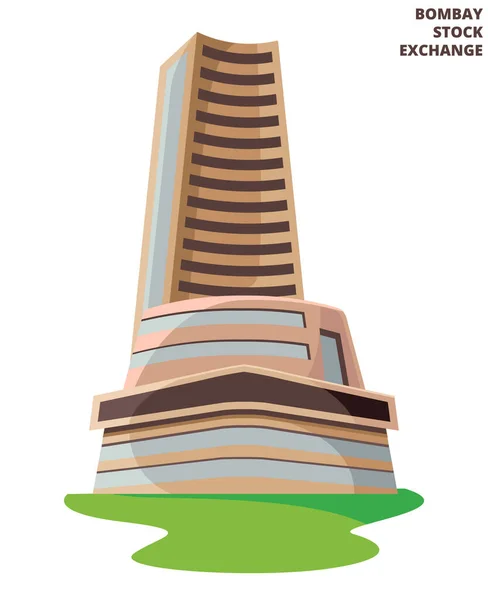
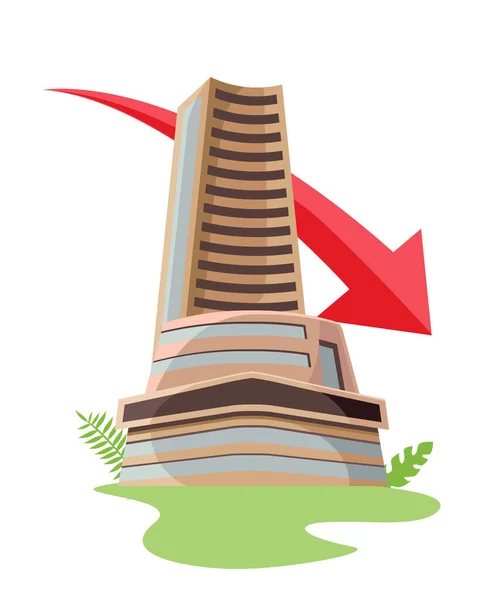
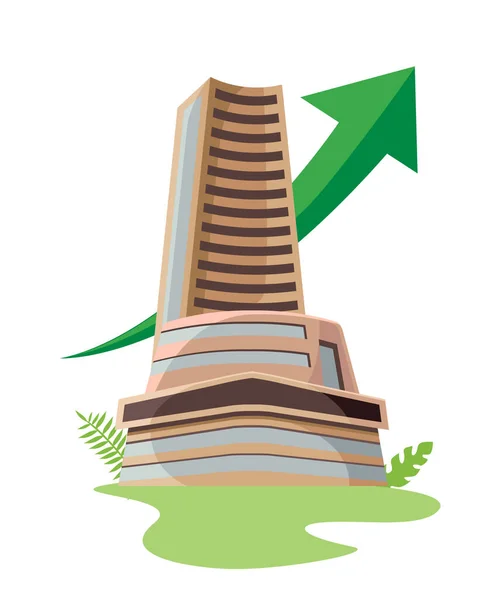
Bombay Stock Exchange , BSE Building, Mumbai India Vector Illustration
Vector, 5.5MB, 3501 × 4301 eps

Financial Instruments With Various Type Of Indicators Including Volume Analysis For Professional Technical Analysis On The Monitor Of A Computer.
Image, 4.85MB, 8268 × 4724 jpg

The Bombay Stock Exchange (BSE) Is An Indian Stock Exchange Located At Dalal Street, Kala Ghoda, Mumbai (formerly Bombay), Maharashtra, India.
Image, 9.03MB, 6400 × 4000 jpg
The S&P BSE SENSEX Is A Free-float Market-weighted Stock Market Index Of 30 Well-established And Financially Sound Companies Listed On Bombay Stock Exchange. 3D Illustration.
Image, 6.32MB, 6500 × 3656 jpg
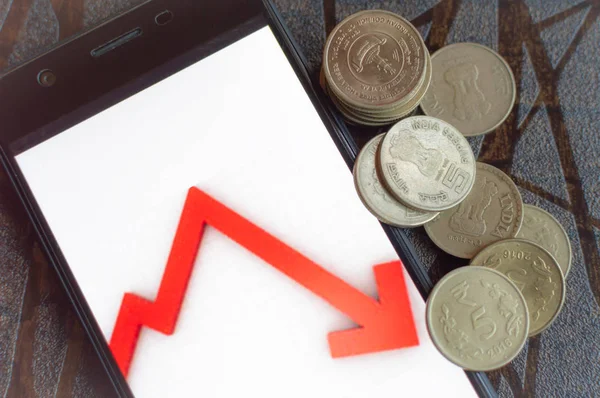
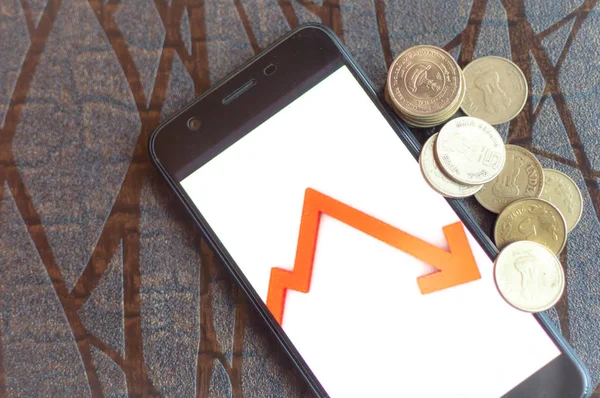
Indian Stock Market Falls. Mobile App For Stock Market. Shares Sold For Coins
Image, 9.96MB, 6016 × 4000 jpg

Financial Instruments With Various Type Of Indicators Including Volume Analysis For Professional Technical Analysis On The Monitor Of A Computer.
Image, 7.72MB, 5472 × 3648 jpg

Flags Of Main Countries In The World With A Display Of Daily Stock Market Price And Quotations.
Image, 6.05MB, 6016 × 4016 jpg


Analysis Business Accounting On Info Sheets. Businessman Hand Working On Analyzing Investment Charts For Gold Market, Forex Market And Trading Market.
Image, 8.3MB, 5315 × 3543 jpg
Analysis Business Accounting On Info Sheets. Businessman Hand Working On Analyzing Investment Charts For Gold Market, Forex Market And Trading Market.
Image, 3.54MB, 5315 × 3543 jpg
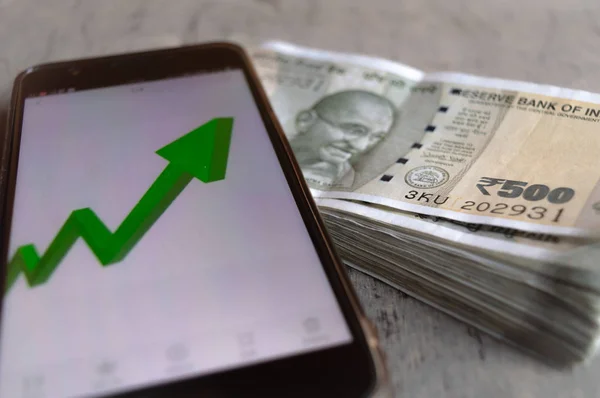
Srinagar, Jammu And Kashmir, India- Dated: August 31, 2018: Indian Stock Market Rises. Mobile App For Stock Market. Rupee Becomes Stonger Against Dollar.
Image, 8.59MB, 6016 × 4000 jpg

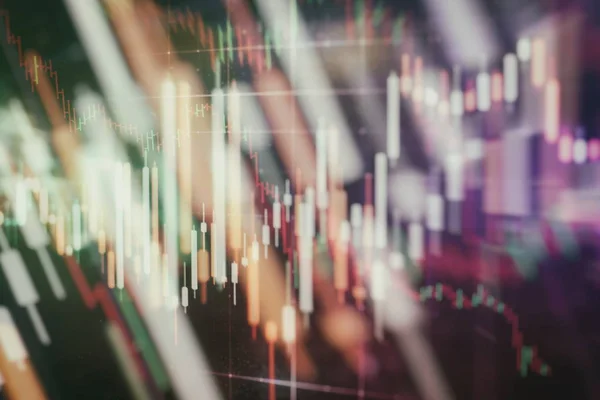
Abstract Futuristic Technology Background Of Fundamental Analysis Vs Technical Analysis Stock Market Price Chart
Vector, 13.78MB, 6000 × 3375 eps


Indicators Including Volume Analysis For Professional Technical Analysis On The Monitor Of A Computer. Fundamental And Technical Analysis Concept.
Image, 6.05MB, 8268 × 4724 jpg

The S&P BSE SENSEX Is A Free-float Market-weighted Stock Market Index Of 30 Well-established And Financially Sound Companies Listed On Bombay Stock Exchange. Down.
Image, 10.37MB, 6400 × 4000 jpg
Global Stock Market Crashes And Very Less Returns From Shares. Shares Sold For Lower Prices
Image, 11.22MB, 6016 × 4000 jpg

Indian Stock Market Falls. Mobile App For Stock Market. Stock Prices Fall. Loss
Image, 10.22MB, 6016 × 4000 jpg

Stock Market Bull And Bear With Indian Flag As Background - Concept Of Investment In Indian Equity Sensex Share Market
Image, 9.63MB, 6000 × 4000 jpg
Analyzing Investment Statistics And Indicators On Dashboard For Trading Products.
Image, 9.69MB, 8268 × 4252 jpg

Analysis Business Accounting On Info Sheets. Businessman Hand Working On Analyzing Investment Charts For Gold Market, Forex Market And Trading Market.
Image, 8.65MB, 5315 × 3543 jpg


BSE Sensex Global Stock Market Index. With A Dark Background And A World Map. Graphic Concept For Your Design.
Image, 8.63MB, 5525 × 3684 jpg


Analysis For Professional Technical Analysis On The Monitor Of A Computer.
Image, 8.84MB, 5472 × 3648 jpg
Previous << Page 2 >> Next