
Stock image Trend Data page 3

Technology Background For Smart City With Internet Of Things Technology And Big Data Concept
Image, 20.56MB, 5500 × 3671 jpg


Hacker In Hoodie Using Glowing Forex Chart Trading Screen On Blurry Background. Market, Hacking, Malware, Data Theft, Economy And Data Exchange Concept. Double Exposure
Image, 7.78MB, 6000 × 4000 jpg

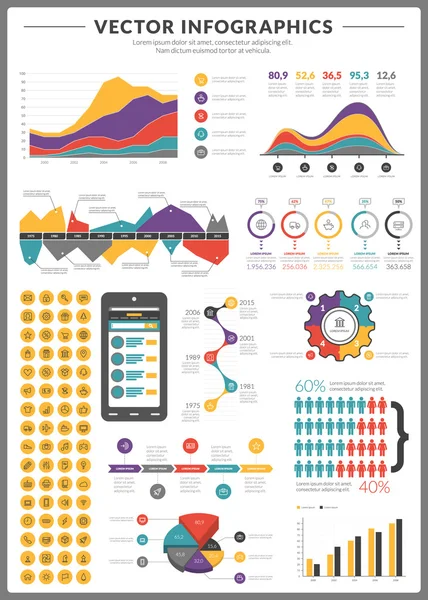
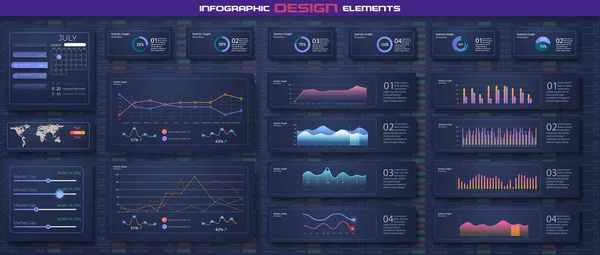
Big Pack Of Data Visualization Vector Infographics And Design Elements With Business Bar, Charts, Graph, Diagrams And Icon Set For Brochures, Flyers And Websites
Vector, 5.05MB, 3875 × 5425 eps


Businesswoman Drawing Graphs And Diagrams On Blackboard. Back View. Concept Of Data Analysis.
Image, 10.11MB, 4952 × 3945 jpg


Big Data Technology For Business Finance Analytic Concept. Modern Graphic Interface Shows Massive Information Of Business Sale Report, Profit Chart And Stock Market Trends Analysis On Screen Monitor.
Image, 12.23MB, 8566 × 5227 jpg


Big Data Technology For Business Finance Analytic Concept. Modern Graphic Interface Shows Massive Information Of Business Sale Report, Profit Chart And Stock Market Trends Analysis On Screen Monitor.
Image, 17.02MB, 7828 × 4240 jpg


Infographics Concept Icon. Awareness Content Idea Thin Line Illustration. Content Marketing Channel. Statistics, Web Analytics, Smm Metrics. Vector Isolated Outline Drawing. Editable Stroke
Vector, 0.5MB, 5000 × 5000 eps

Magnifying Glass With Investment Report On Digital Screen. Forecast And Invest Concept. 3D Rendering
Image, 3.38MB, 4500 × 3000 jpg
Growing Linear 3d Illustration Graph Showing Positive Growth And Trends With Numbers In Blue Violet Color On Blue Tech Background With Motion
Image, 6.32MB, 5000 × 2813 jpg


Businesswoman Wearing White Shirt Is Touching Chin With Pencil Holding Notebook. New York City Skyscraper In The Background. Forex Candlesticks And Financial Graph, Chart And Bar Diagram In Foreground
Image, 12.14MB, 7485 × 3986 jpg

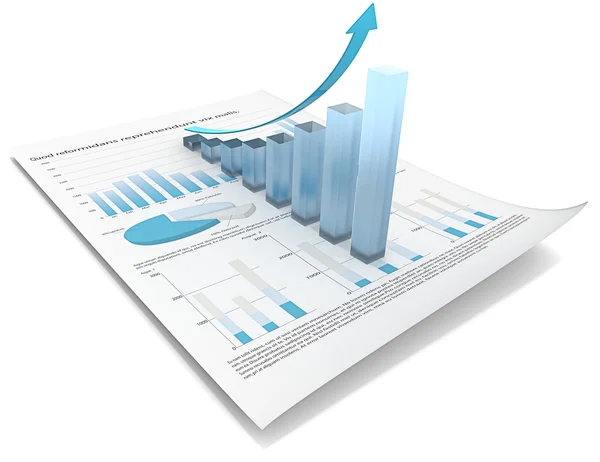
Financial Rising Graph And Chart With Numbers, Bar Diagrams That Illustrate Investment Management On Stock Market. Concept Of Successful Trading. 3d Render
Image, 4.32MB, 5271 × 3202 jpg

Big Data Technology For Business Finance Analytic Concept. Modern Graphic Interface Shows Massive Information Of Business Sale Report, Profit Chart And Stock Market Trends Analysis On Screen Monitor.
Image, 10.84MB, 9283 × 5717 jpg

Financial Rising Graph And Chart With Numbers, Bar Diagrams That Illustrate Investment Management On Stock Market. Concept Of Successful Trading. Blurred Office In The Background. 3d Render
Image, 7.03MB, 6010 × 3696 jpg

Customer Data Platform Concept - CDP - AdTech Solutions - Software To Create Unified Customer Database For Marketing And Commercial Purposes - 3D Illustration
Image, 7.49MB, 7890 × 5231 jpg


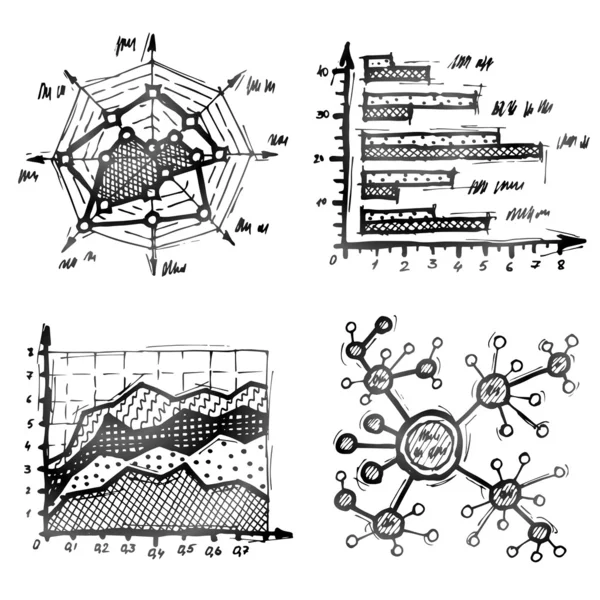
Business Graph With Tending. Stock Market Data Display Concept. Stock Market Prices. Candle Stick Stock Market Tracking Graph. Economical Stock Market Graph.
Vector, 12.83MB, 8000 × 5000 eps

Close Up Of Hand At Desktop Using Smartphone With Various Forex Screens On Blurry Background. Cryptocurrency, Bticoin Trading And Finance Concept. Double Exposure
Image, 9.76MB, 6006 × 4000 jpg

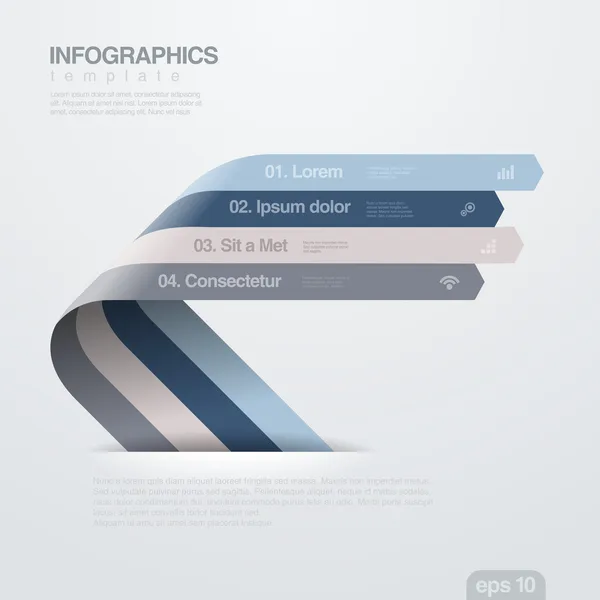
Infographic Dashboard Template With Flat Design Graphs And Pie Charts Online Statistics And Data Analytics. Information Graphics Elements For UI UX Design. Modern Style Web Elements.
Vector, 6.34MB, 9785 × 4167 eps


Previous << Page 3 >> Next