
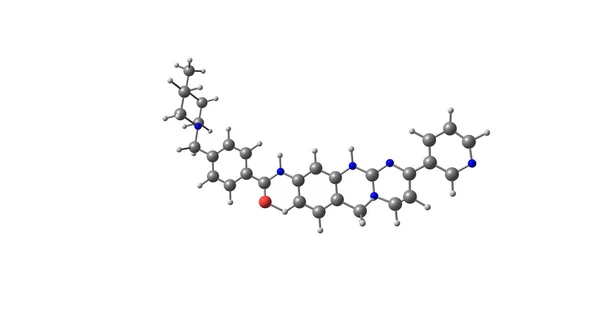
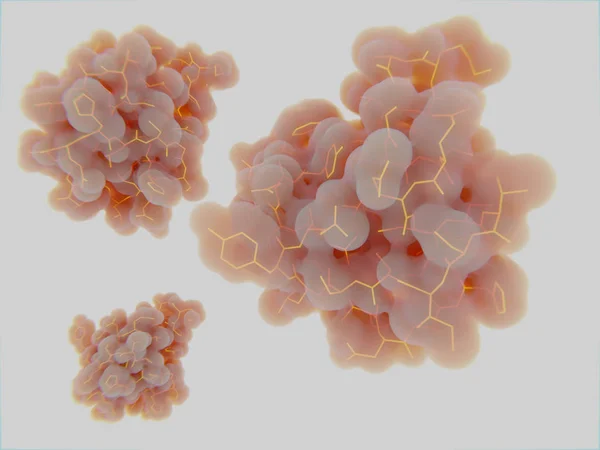
Stock image Tyrosine Kinase

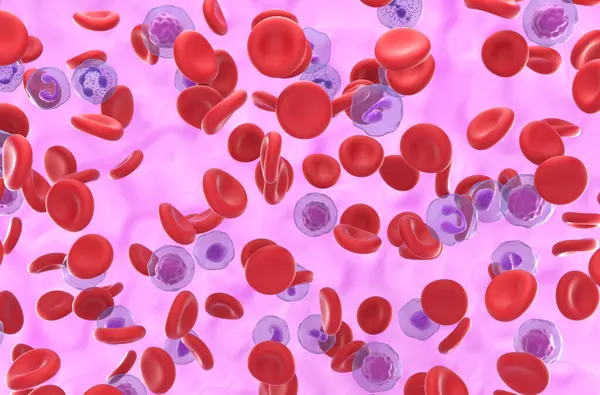
High Level Of RBC And Platelet In Polycythemia Vera (PV) - Closeup View 3d Illustration
Image, 5.49MB, 10000 × 6600 jpg

High Level Of RBC And Platelet In Polycythemia Vera (PV) - Isometric View 3d Illustration
Image, 7.68MB, 10000 × 6600 jpg

High Level Of Red Blood Cell In Polycythemia Vera (PV) - Closeup View 3d Illustration
Image, 6.44MB, 10000 × 6600 jpg
High Level Of Red Blood Cell In Polycythemia Vera (PV) - Isometric View 3d Illustration
Image, 7.99MB, 10000 × 6600 jpg
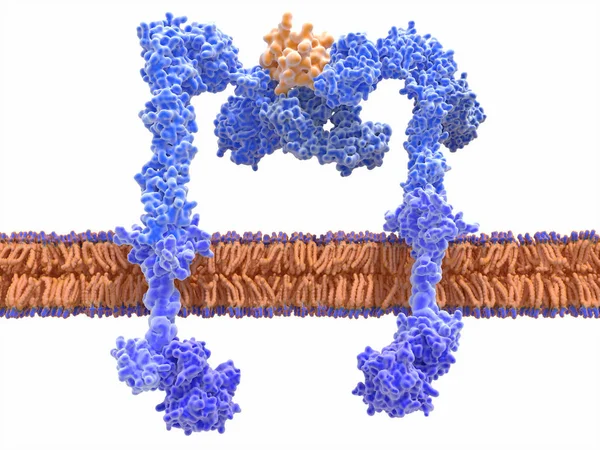
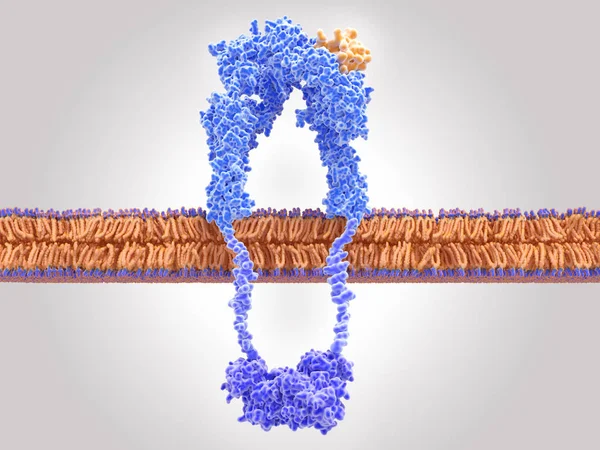
The Insulin Receptor (blue) Is A Transmembrane Protein, That Is Activated By Insulin (orange). Insulin Binding Induces Structural Changes Within The Receptor That Finally Leads To The Activation Of The Glucose Transporter Protein.
Image, 12.2MB, 8000 × 6000 jpg

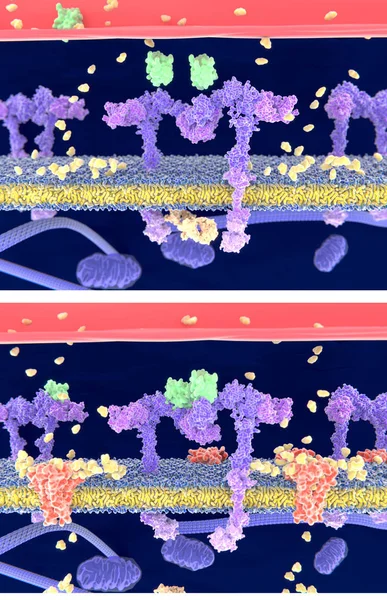
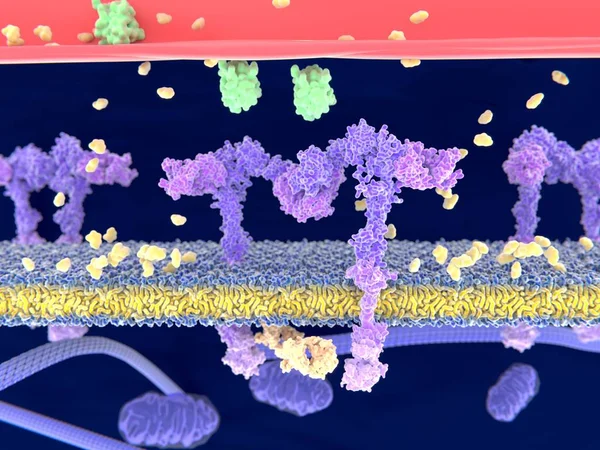
Insulin (green) Binding To The Insulin Receptor (violet) Activates The Transport Of Glucose (yellow) Into The Cell (depicted In 2 Phases) - Illustration
Image, 4.57MB, 4000 × 6200 jpg
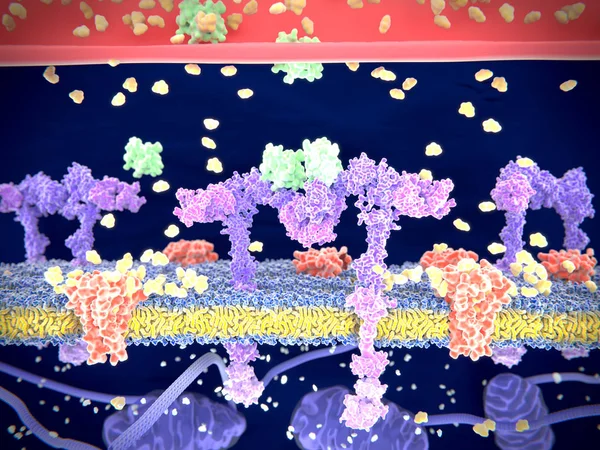
Insulin (green) Binding To The Insulin Receptor (violet) Activates The Transport Of Glucose (yellow) Into The Cell. Illustration
Image, 6.21MB, 8000 × 6000 jpg
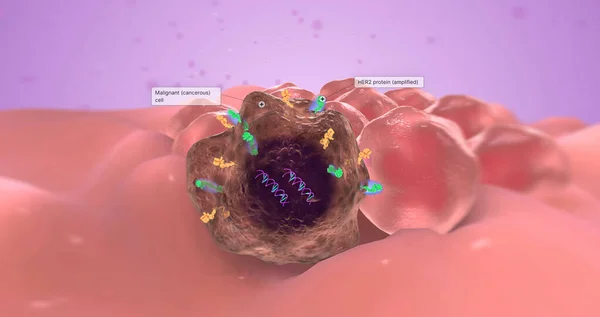
The Abnormal Gene Is Known As An Oncogene Because It Causes Tumor Growth. 3D Rendering
Image, 2.86MB, 7340 × 3884 jpg
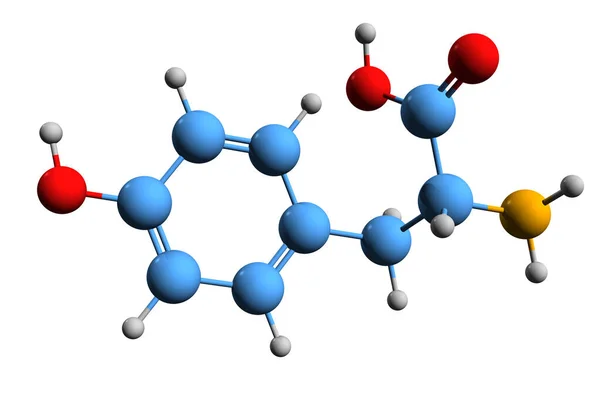
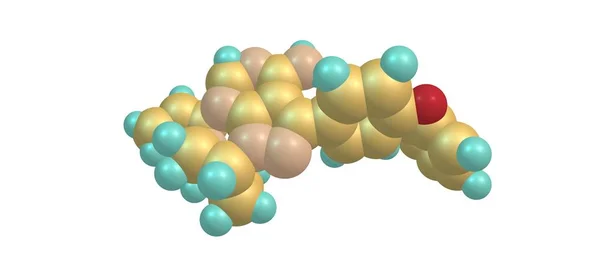
3D Image Of Tyrosine Skeletal Formula - Molecular Chemical Structure Of 4-hydroxyphenylalanine Isolated On White Background
Image, 2.01MB, 5500 × 3630 jpg
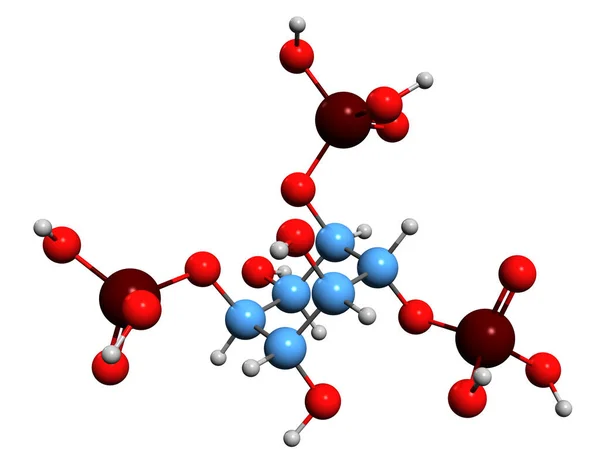
3D Image Of Inositol Trisphosphate Skeletal Formula - Molecular Chemical Structure Of Inositol Phosphate Signaling Molecule Isolated On White Background
Image, 3.87MB, 6943 × 5520 jpg
Insulin (green) Binding To The Insulin Receptor (violet) Activates The Transport Of Glucose (yellow) Into The Cell. Illustration
Image, 3.71MB, 8000 × 6000 jpg

Insulin (green) Binding To The Insulin Receptor (violet) Activates The Transport Of Glucose (yellow) Into The Cell (phase 1). Illustration
Image, 3.96MB, 8000 × 6000 jpg

Doctor Holding A Test Blood Sample Tube With EGFR Test On The Background Of Medical Test Tubes With Analyzes.
Image, 8.65MB, 5789 × 3859 jpg

Doctor Holding A Test Blood Sample Tube With EGFR Test On The Background Of Medical Test Tubes With Analyzes.
Image, 9.04MB, 6000 × 4000 jpg
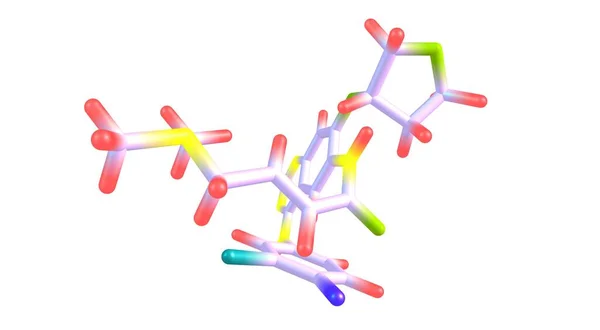
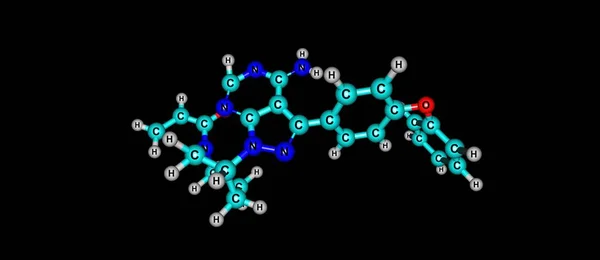
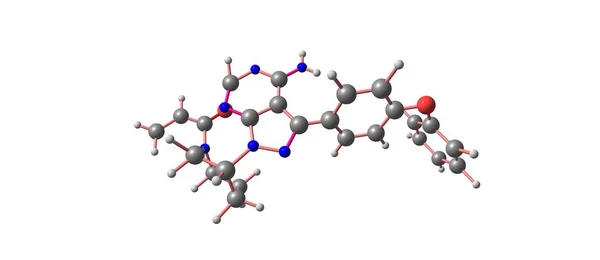
Afatinib Is A Medication Used To Treat Non-small Cell Lung Carcinoma, NSCLC. 3d Illustration
Image, 0.69MB, 7000 × 3855 jpg
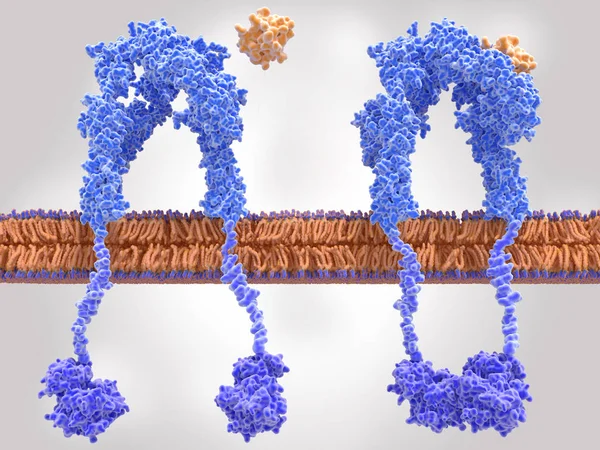
Insulin Receptor Inactivated (left) And Activated (right) After Insulin Binding
Image, 9MB, 8000 × 6000 jpg

Page 1 >> Next