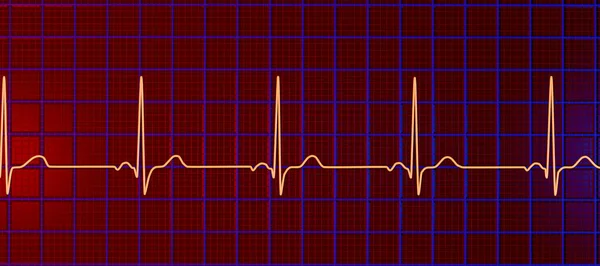
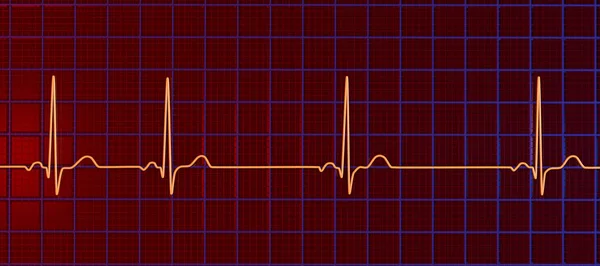
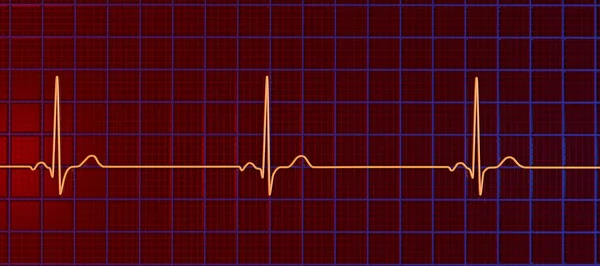
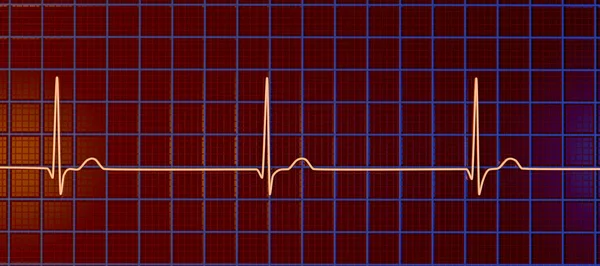
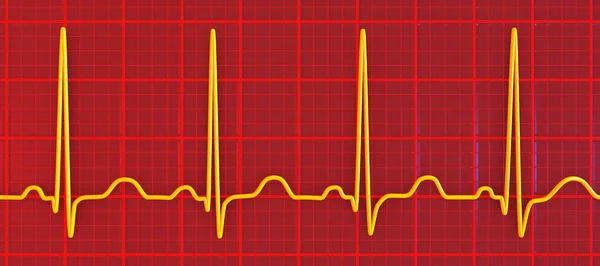
Stock image A detailed 3D illustration of an Electrocardiogram ECG displaying sinus tachycardia, a regular cardiac rhythm with heart rate that is higher than the upper limit of normal of 90-100 bpm in adults.
Published: Jun.19, 2023 08:55:55
Author: katerynakon
Views: 25
Downloads: 0
File type: image / jpg
File size: 12.95 MB
Orginal size: 9000 x 4000 px
Available sizes:
Level: silver