Home
Images
Vectors
Videos
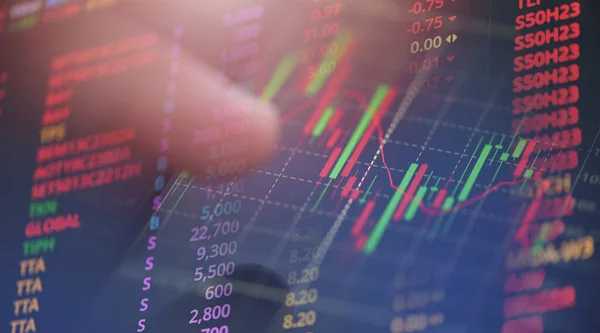
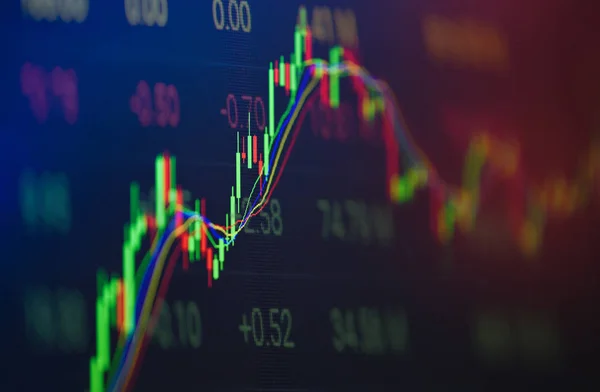
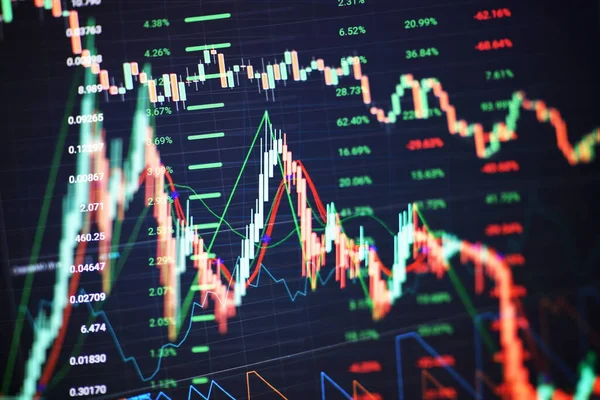
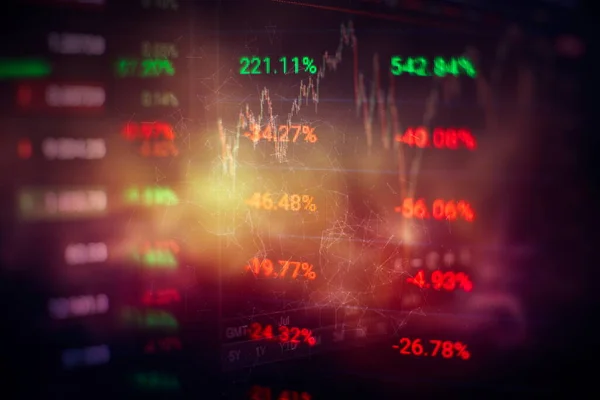
Stock image Analysis business accounting on info sheets. Businessman hand working on analyzing investment charts for Gold market, Forex market and Trading market.
Published:
Jul.16, 2020 06:48:24
Author:
Maximusdn
Views:
4
Downloads:
1
File type:
image
/
jpg
File size:
6.05 MB
Orginal size:
5472
x
3648
px
Available sizes:
S
(500 x 333)
M
(1000 x 667)
L
(2000 x 1333)
XL
(5472 x 3648)
EL0
(5472 x 3648)
Level:
bronze
Download Image
Image topics:
Money
High
Buy
Financial
Market
Rate
Growth
Corporate
Estate
Real
Global
Equity
Bank
Exchange
Investment
Finance
Invest
Stock
Wheel
Security
Gain
System
Instruments
Free
Purchase
Yield
Value
Investing
Fixed
Debt
Commodity
Trade
Government
Pension
Portfolio
Bond
Revenue
Profit
Coupon
Fund
Investor
Mutual
Shares
Dividend
Municipal
Diversify
Trusts
Etf
Capm
Securitization
Similar stock images
Economic Graph With Diagrams On The Stock Market, For Business And Financial Concepts And Reports.Abstract Blue Background.
5472 × 3648
Economy Trends Background For Business Idea . Financial Graph On Technology Abstract Background Represent Financial Crisis
8858 × 4724
Technical Price Graph And Indicator, Red And Green Candlestick Chart On Blue Theme Screen
9803 × 4488
Trading Chart And Candlestick Chart Suitable For Financial Investment Ideas, Economic Trends, Background For All Business Ideas And Art Designs
8268 × 4724
Image Of Financial Data Processing And Stock Market Over Empty Office. Global Business, Finances And Data Processing Concept Digitally Generated Image.
4096 × 2160
Stock Market Graph Chart - Stock Exchange Trading Analysis Investment Financial Display Stock Crisis Crash Down And Grow Up Trand Profits Financial Or Forex Graph Stock Market Digital Graph Business
6016 × 3344
Stock Exchange Market Or Forex Trading Graph Analysis Investment
5645 × 3696
Data Analyzing From Charts And Graph To Find Out The Result In Trading Market. Working Set For Analyzing Financial Statistics And Analyzing A Market Data.
5315 × 3543