photo free
Home Images Vectors Videos

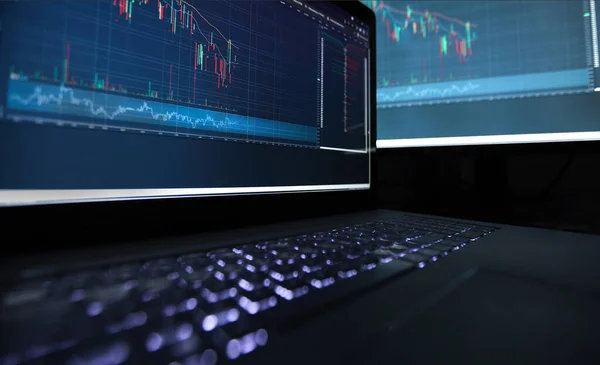
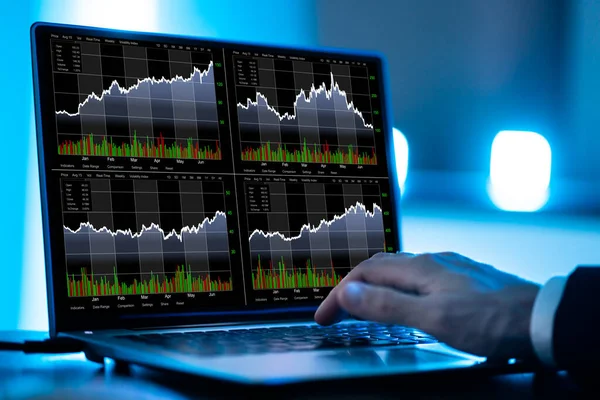
Stock image Candle stick graph chart of stock market investment trading, Bullish point, Bearish point. trend of graph

Stock image Candle stick graph chart of stock market investment trading, Bullish point, Bearish point. trend of graph
Published: Aug.07, 2018 10:32:15
Author: FotoArtist
Views: 16
Downloads: 5
File type: image / jpg
File size: 29.1 MB
Orginal size: 5471 x 3648 px
Available sizes:
S
(500 x 333)
M
(1000 x 667)
L
(2000 x 1334)
XL
(5471 x 3648)
EL0
(5471 x 3648)
Level: bronze
Download Image
Image topics:

Similar stock images

stock image Laptop screen with stock market charts. Technical analysis and fundamental indicators of stock quotes in the trading terminal. Japanese candlesticks and company tickers.

Laptop Screen With Stock Market Charts. Technical Analysis And Fundamental Indicators Of Stock Quotes In The Trading Terminal. Japanese Candlesticks And Company Tickers.

5000 × 3048
stock image Close up shot of financial analysis graph chart stock exchange bitcoin cryptocurrency report on computer screen monitors and laptop on working in trading room while broker meeting in shadow behind.

Close Up Shot Of Financial Analysis Graph Chart Stock Exchange Bitcoin Cryptocurrency Report On Computer Screen Monitors And Laptop On Working In Trading Room While Broker Meeting In Shadow Behind.

6593 × 3603
stock image Stock Trader Man Using Laptop Computer Screen

Stock Trader Man Using Laptop Computer Screen

9090 × 6060
stock image Stock Broker Exchange Trading App On Laptop

Stock Broker Exchange Trading App On Laptop

8594 × 5730
stock image Monitor with stock exchange data, closeup

Monitor With Stock Exchange Data, Closeup

5760 × 3840
stock image Hands of trader pushing button on keyboard hurrying to buy stocks on market

Hands Of Trader Pushing Button On Keyboard Hurrying To Buy Stocks On Market

8256 × 5504