
Stock image Bearish
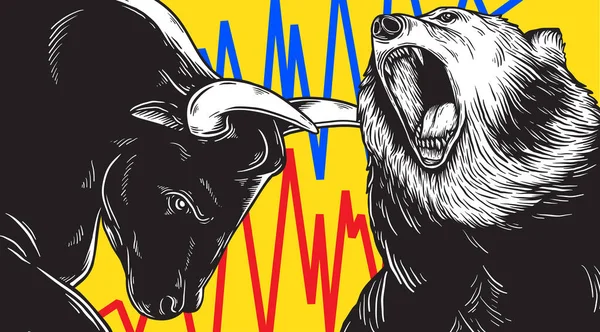
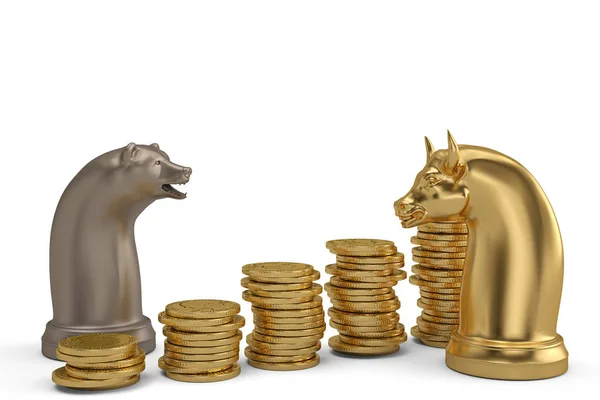
Vector Of Bull And Bear Symbols Of Stock Market Trends. The Growing And Falling Market. Easy Editable Layered Vector Illustration. Wild Animals.
Vector, 5.4MB, 6500 × 6500 eps
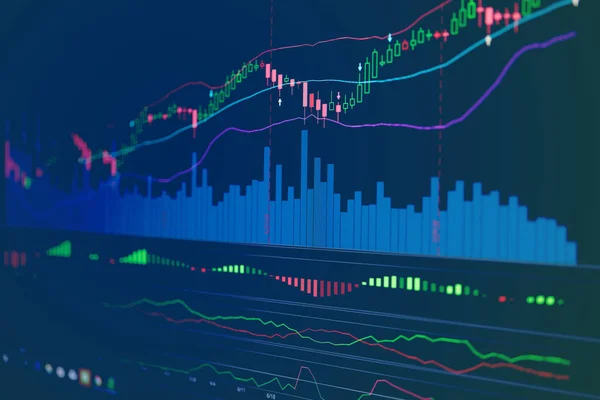
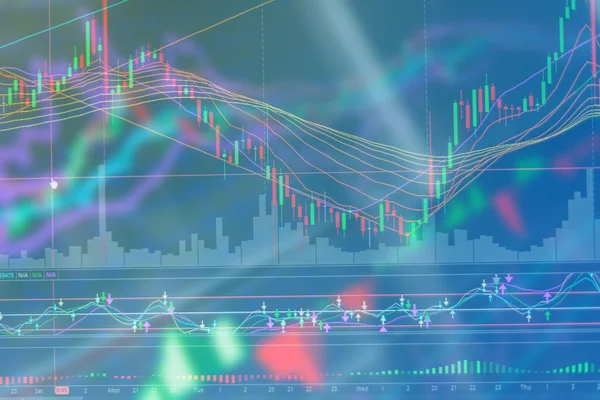
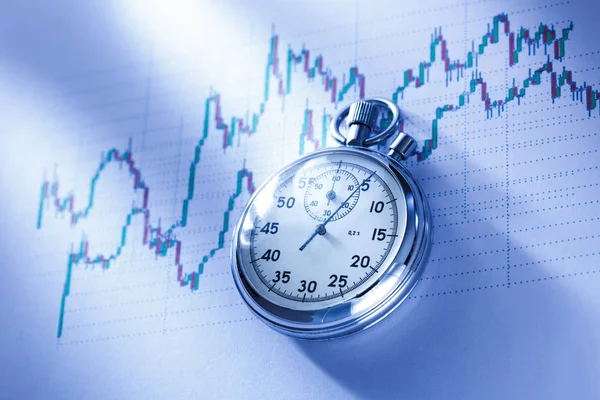
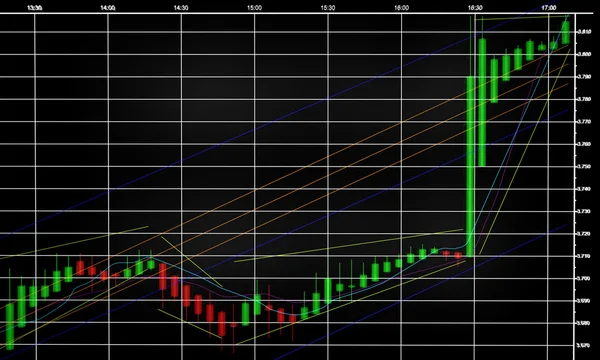
Financial Business Stock Market Graph Chart Candle Stick Screen Monitor
Image, 7.44MB, 7952 × 5304 jpg

Bull And Bear As A Symbol Figure. Place In Front Of The Building Of The Frankfurt Stock Exchange. Commercial Buildings With A Brown Facade In The Sunshine And Blue Sky With Clouds
Image, 18.87MB, 5472 × 3648 jpg

Investing Financial Symbol With A Two Business Icons Representing The Bear And Bull Markets With A Stock Market Chart And Ticker Investing Graph In A 3D Illustration Style.
Image, 5.79MB, 4721 × 3000 jpg


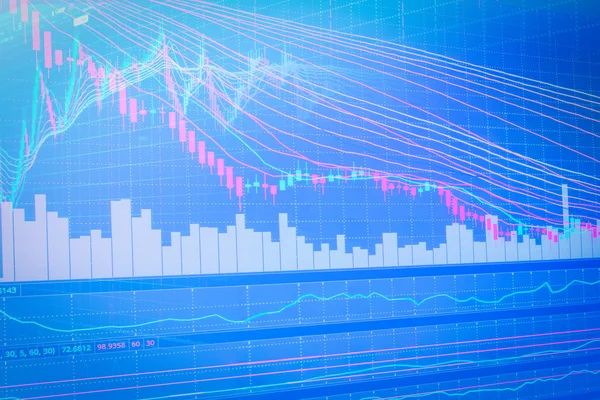
Financial Business Stock Market Graph Chart Candle Stick Screen Monitor
Image, 16.53MB, 7952 × 5304 jpg


Bull And Bear Shapes That Look Like Made Of Charts. On White Background. Vector. Illustration. Logo. Symbol. Abstract. Design. Animals. Logo. The Growing Business Market
Vector, 3.4MB, 5000 × 5000 eps

Bull And Bear Shapes That Look Like Made Of Charts. On White Background. Vector. Illustration. Logo. Symbol. Abstract. Design. Animals. Logo. The Growing Business Market
Vector, 3.42MB, 5000 × 5000 eps
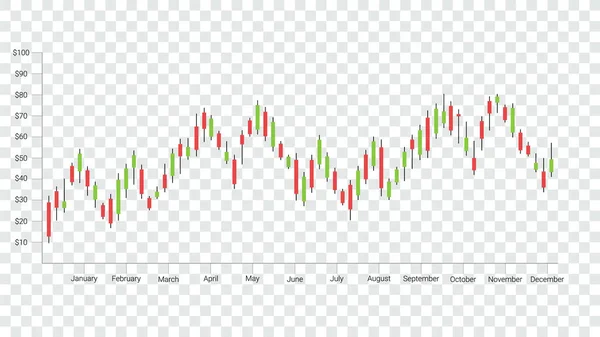
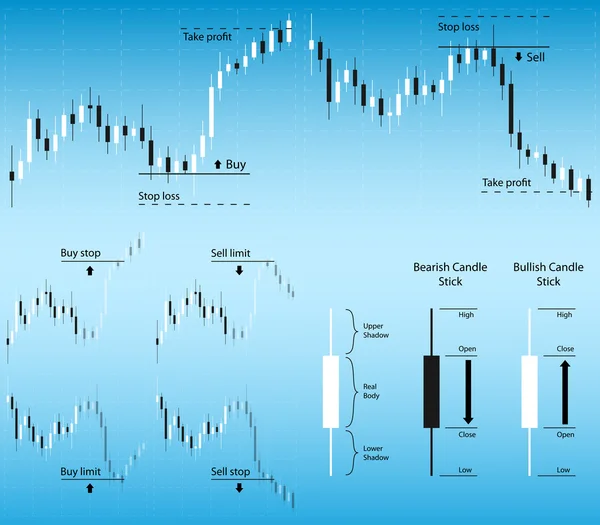
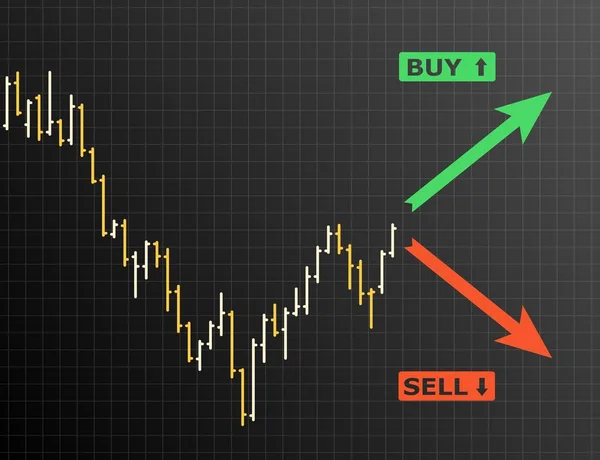
Forex Stock Market Investment Trading Concept, Candlestick Pattern With Bullish And Bearish Is A Style Of Financial Chart.
Vector, 4.81MB, 6398 × 3600 eps


Candle Stick Graph Chart Of Stock Market Investment Trading Business Finance And Investment Concept
Image, 8.46MB, 5472 × 3648 jpg


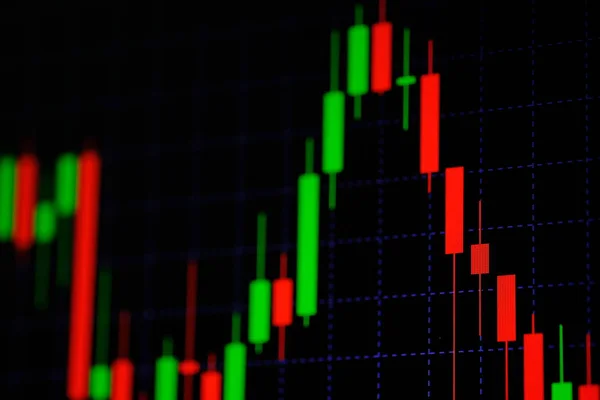
Candle Stick Graph Chart With Indicator Showing Bullish Point Or Bearish Point, Up Trend Or Down Trend Of Price Of Stock Market Or Stock Exchange Trading, Investment And Financial Concept. Thin Focus.
Image, 13.09MB, 6000 × 4000 jpg

Candle Stick Graph Chart With Indicator Showing Bullish Point Or Bearish Point, Up Trend Or Down Trend Of Price Of Stock Market Or Stock Exchange Trading, Investment And Financial Concept. Thin Focus.
Image, 8.8MB, 6000 × 4000 jpg

Candle Stick Graph Chart Of Stock Market Investment Trading, Bullish Point, Bearish Point. Trend Of Graph Vector Design.
Vector, 10.77MB, 6257 × 2846 eps


Bar Financial Data Graph. Forex Stock Crypto Currency Data Visualization.
Vector, 2.37MB, 6251 × 4800 eps
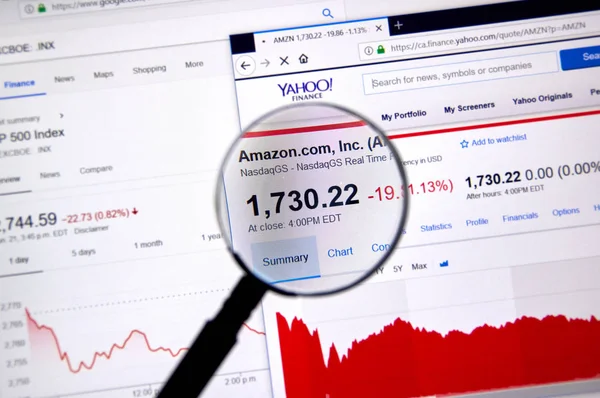
MONTREAL, CANADA - JUNE 22, 2018: Amazon AMZN Ticker And Price Shares With Charts Under Magnifying Glass On Yahoo Finance.
Image, 18.96MB, 5377 × 3574 jpg

Bullish And Bearish Markets. Silhouette Of A Bull And A Bear In Front Of Trending. Financial Market Trends. Vector.
Vector, 0.29MB, 5000 × 5000 eps

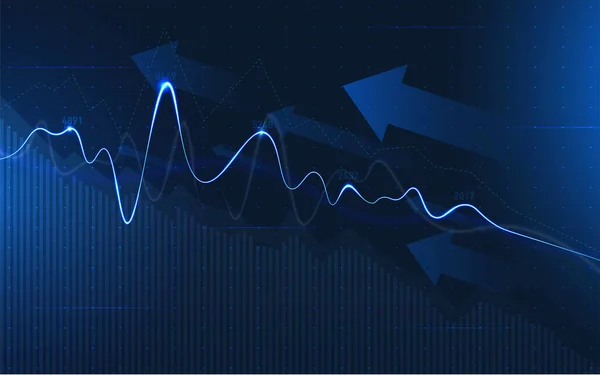
Financial Stock Market Graph On Stock Market Investment Trading, Bullish Point, Bearish Point. Trend Of Graph For Business Idea And All Art Work Design. Vector Illustration.
Vector, 10.48MB, 7952 × 4972 eps


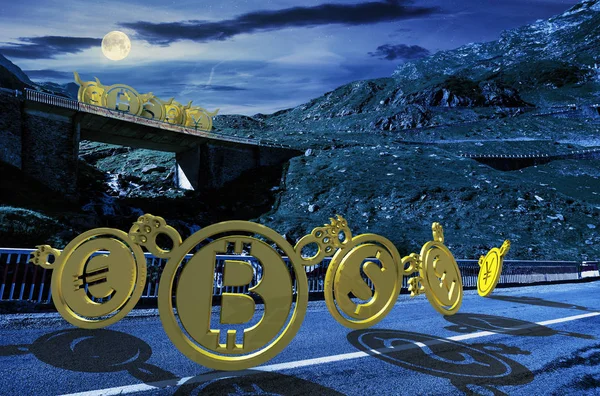
Bullish Or Bearish Marketing Trend. Bears Down The Road Make Fun Of Bulls Up On The Bridge. Currency Market Trading At Night In Full Moon Light
Image, 6.26MB, 3095 × 2046 jpg

Candle Stick Graph Chart With Indicator Showing Bullish Point Or Bearish Point, Up Trend Or Down Trend Of Price Of Stock Market Or Stock Exchange Trading, Investment And Financial Concept. Thin Focus.
Image, 5.56MB, 6016 × 4016 jpg


Page 1 >> Next