photo free
Home Images Vectors Videos

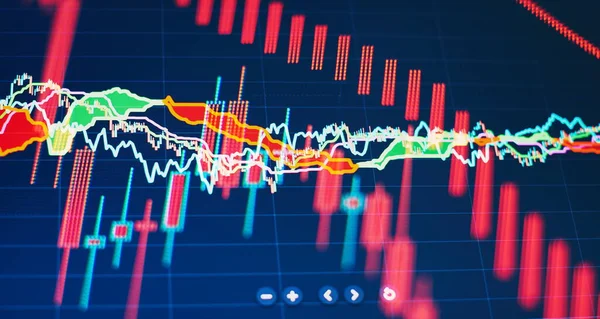
Stock image Candle stick graph chart with indicator showing bullish point or

Stock image Candle stick graph chart with indicator showing bullish point or
Published: Nov.06, 2017 10:04:37
Author: pookpiik
Views: 0
Downloads: 0
File type: image / jpg
File size: 11.55 MB
Orginal size: 6016 x 4016 px
Available sizes:
S
(500 x 334)
M
(1000 x 668)
L
(2000 x 1335)
XL
(6016 x 4016)
EL0
(6016 x 4016)
Level: bronze
Download Image
Image topics:

Similar stock images

stock image Candle stick graph chart with indicator showing bullish point or

Candle Stick Graph Chart With Indicator Showing Bullish Point Or

6016 × 4016
stock image Candle stick graph chart with indicator showing bullish point or

Candle Stick Graph Chart With Indicator Showing Bullish Point Or

6016 × 4016
stock image Market Analyze. Bar graphs, Diagrams, financial figures. Abstract glowing forex chart interface wallpaper. Investment, trade, stock, finance

Market Analyze. Bar Graphs, Diagrams, Financial Figures. Abstract Glowing Forex Chart Interface Wallpaper. Investment, Trade, Stock, Finance

8858 × 4724
stock image Candle stick graph chart with indicator showing bullish point or

Candle Stick Graph Chart With Indicator Showing Bullish Point Or

6016 × 4016
stock image Daily trading prices stock market graph showing on the screen.Daily investor's business everyday life.Selective focus.

Daily Trading Prices Stock Market Graph Showing On The Screen.Daily Investor's Business Everyday Life.Selective Focus.

6016 × 4016
stock image Candle stick graph chart of stock market investment trading, monotone color, Bullish point, Bearish point. trend of graph.

Candle Stick Graph Chart Of Stock Market Investment Trading, Monotone Color, Bullish Point, Bearish Point. Trend Of Graph.

5472 × 3648
stock image Business candlestick. Financial static analysis with growing financial charts. Online trading, Investment, Strategy market plan, and Stock market fluctuations Concept.

Business Candlestick. Financial Static Analysis With Growing Financial Charts. Online Trading, Investment, Strategy Market Plan, And Stock Market Fluctuations Concept.

8268 × 4724