Home
Images
Vectors
Videos
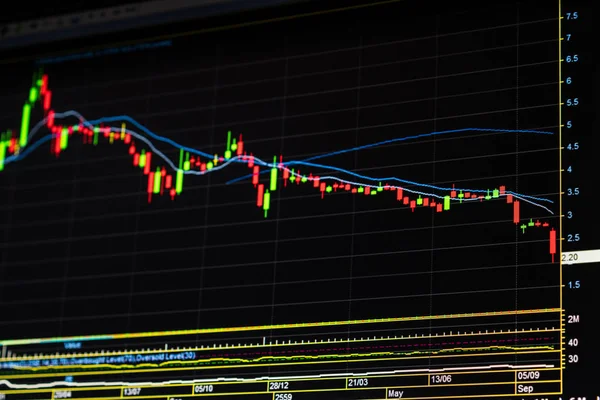
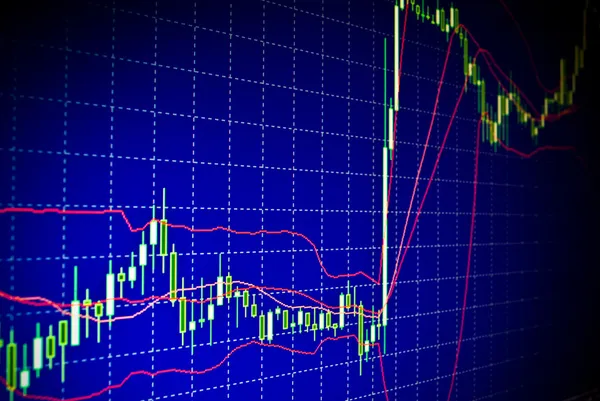
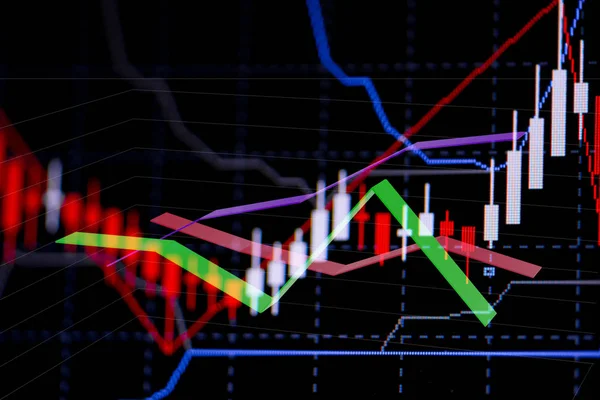
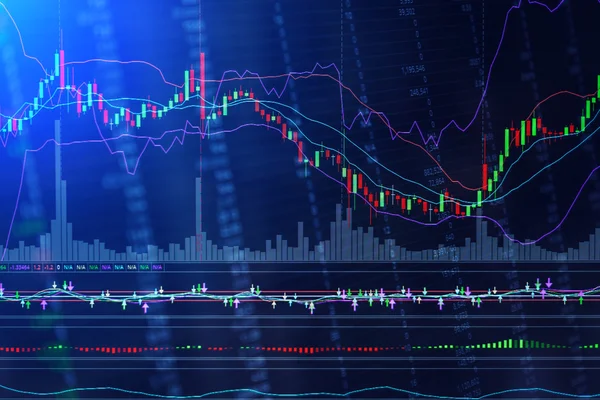
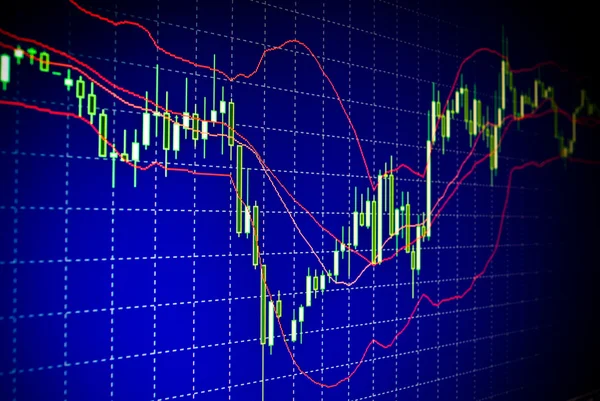
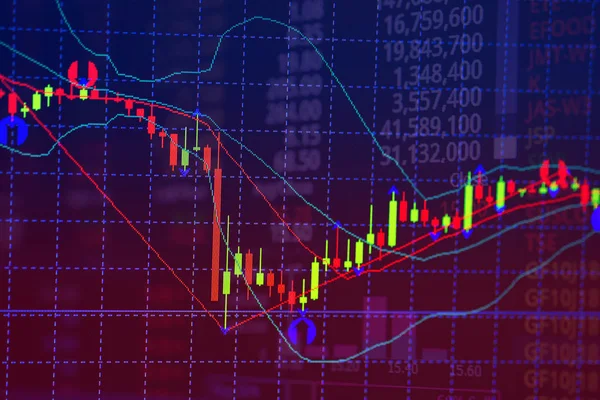
Stock image Double exposure of candle stick graph chart with indicator with stock market price screen background, stock exchange trading, investment and financial concept idea.
Published:
Nov.28, 2018 14:22:43
Author:
pookpiik
Views:
7
Downloads:
1
File type:
image
/
jpg
File size:
10.69 MB
Orginal size:
6000
x
4000
px
Available sizes:
S
(500 x 333)
M
(1000 x 667)
L
(2000 x 1333)
XL
(6000 x 4000)
EL0
(6000 x 4000)
Level:
bronze
Download Image
Image topics:
Background
Money
Business
Buy
Financial
Market
Trading
Success
Growth
Abstract
Pattern
Technology
Concept
Candle
Display
Screen
Digital
Global
Monitor
Data
Information
Bank
Currency
Exchange
Investment
Finance
Stock
Economy
Volume
Stick
Research
Loss
Analysis
Graph
Chart
Sell
Trade
Profit
Diagram
Investor
Trend
Forex
Bullish
Bearish
Similar stock images
Down Trend Stock Market Graph
5168 × 3448
Candle Stick Graph Chart With Indicator Showing Bullish Point Or
6016 × 4016
Detail Of Electronic Grid Monitor Screen
3777 × 2553
Forex Stock Market Candle Graph Analysis On The Screen
3872 × 2592
Candle Stick Graph Chart With Indicator Showing Bullish Point Or
6016 × 4016
Candle Stick Graph Chart Of Stock Market Investment Trading
5472 × 3648
Forex Stock Market Candle Graph Analysis On The Screen
3872 × 2592
Business Candle Stick Graph Chart Of Stock Market Investment Trading On Cityscape Background
3742 × 2495