photo free
Home Images Vectors Videos

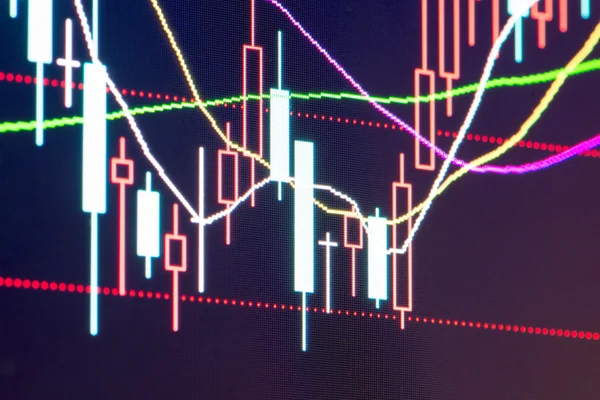
Stock image graph chart of stock market investment trading

Stock image graph chart of stock market investment trading
Published: Oct.19, 2016 10:04:57
Author: whyframeshot
Views: 18
Downloads: 1
File type: image / jpg
File size: 14.91 MB
Orginal size: 5133 x 3422 px
Available sizes:
S
(500 x 333)
M
(1000 x 667)
L
(2000 x 1333)
XL
(5133 x 3422)
EL0
(5133 x 3422)
Level: bronze
Download Image
Image topics:

Similar stock images

stock image business success and growth concept stock finance

Business Success And Growth Concept Stock Finance

5472 × 3648
stock image Charts of financial instruments for technical analysis. Data analyzing in forex market trading: the charts and summary info for forexmaking trading.

Charts Of Financial Instruments For Technical Analysis. Data Analyzing In Forex Market Trading: The Charts And Summary Info For Forexmaking Trading.

8858 × 4724
stock image Candle stick graph chart of stock market investment trading

Candle Stick Graph Chart Of Stock Market Investment Trading

5472 × 3648
stock image Candle stick graph chart of stock market investment trading

Candle Stick Graph Chart Of Stock Market Investment Trading

5472 × 3648
stock image Candle stick graph chart of stock market

Candle Stick Graph Chart Of Stock Market

5472 × 3648
stock image chart of stock market investment trading

Chart Of Stock Market Investment Trading

5045 × 3359
stock image concept of finance background

Concept Of Finance Background

5472 × 3648
stock image Business stats screen

Business Stats Screen

7360 × 4912