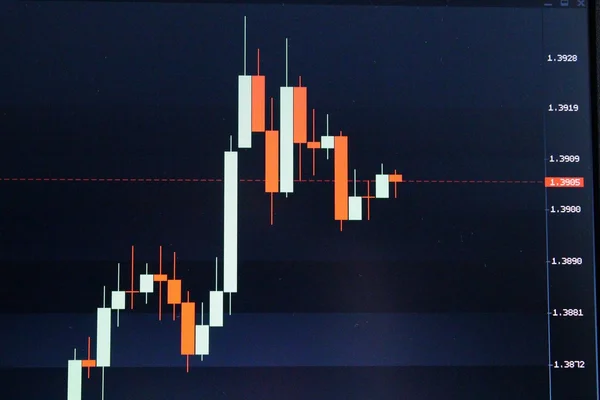
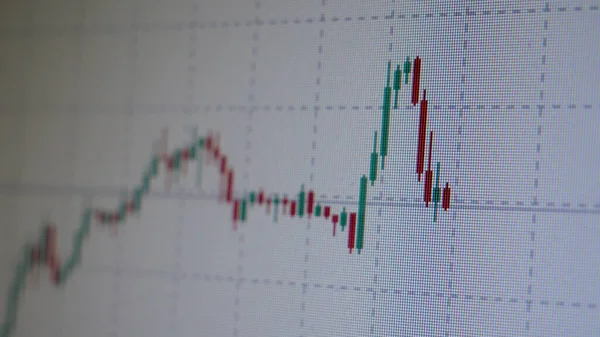
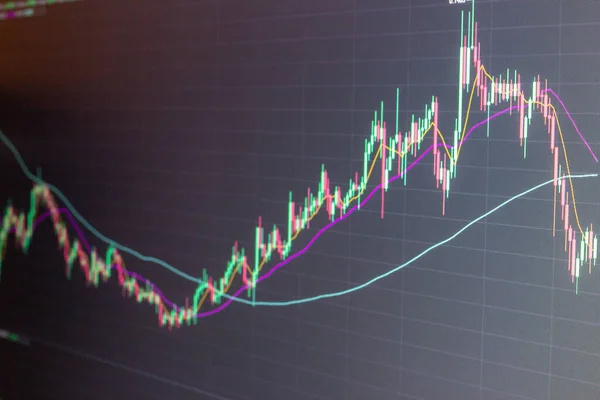
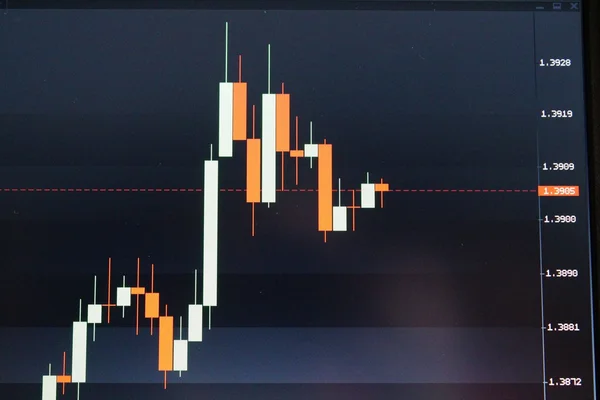
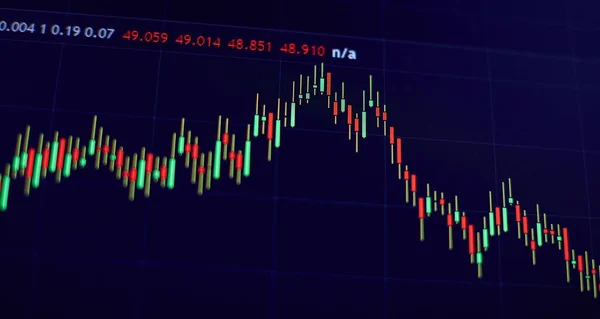
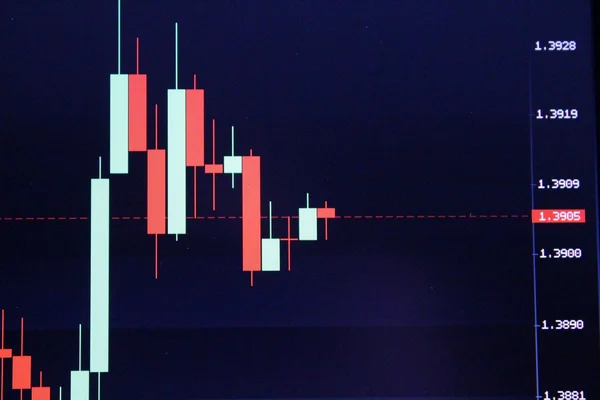
Stock image Stock japanese candles chart
Published: Mar.20, 2014 15:57:46
Author: Alex_Schmidt
Views: 80
Downloads: 2
File type: image / jpg
File size: 1.92 MB
Orginal size: 5184 x 3456 px
Available sizes:
Level: bronze