
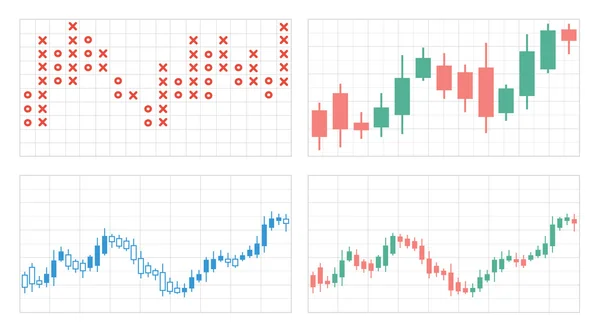
Stock image Japanese Candles


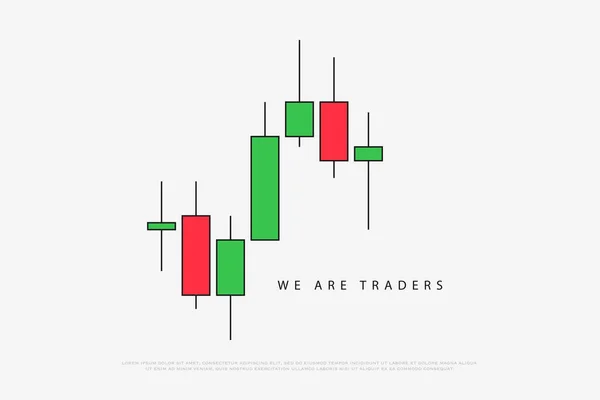
Piercing Line Candlestick Chart Pattern. Set Of Candle Stick. Candle Stick Graph Trading Chart To Analyze The Trade In The Foreign Exchange And Stock Market. Forex Market. Forex Trading. Japanese Candles.
Vector, 2.25MB, 4171 × 4171 eps

Three White Soldiers Candlestick Chart Pattern. Set Of Candle Stick. Candle Stick Graph Trading Chart To Analyze The Trade In The Foreign Exchange And Stock Market. Forex Market. Forex Trading. Japanese Candles.
Vector, 2.26MB, 4171 × 4171 eps

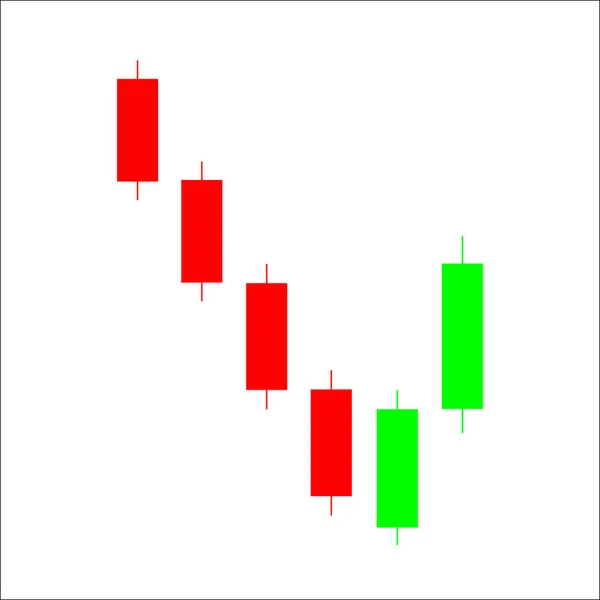
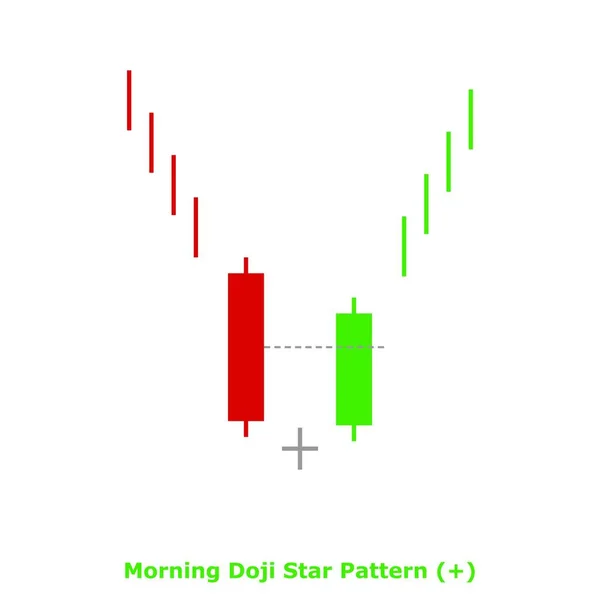
Morning Star Candlestick Chart Pattern. Set Of Candle Stick. Candle Stick Graph Trading Chart To Analyze The Trade In The Foreign Exchange And Stock Market. Forex Market. Forex Trading. Japanese Candles.
Vector, 2.25MB, 4171 × 4171 eps
Piercing Line Candlestick Chart Pattern. Candle Stick Graph Trading Chart To Analyze The Trade In The Foreign Exchange And Stock Market. Forex Market. Forex Trading. Japanese Candles.
Vector, 2.22MB, 4171 × 4171 eps

Inverted Black Hammer Candlestick Chart Pattern. Set Of Candle Stick. Candle Stick Graph Trading Chart To Analyze The Trade In The Foreign Exchange And Stock Market. Forex Market. Forex Trading. Japanese Candles.
Vector, 2.27MB, 4171 × 4171 eps


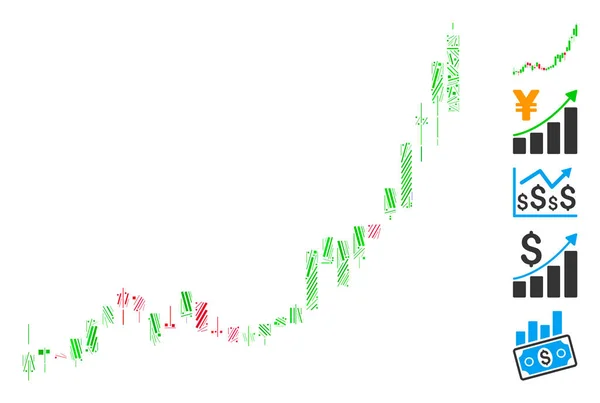
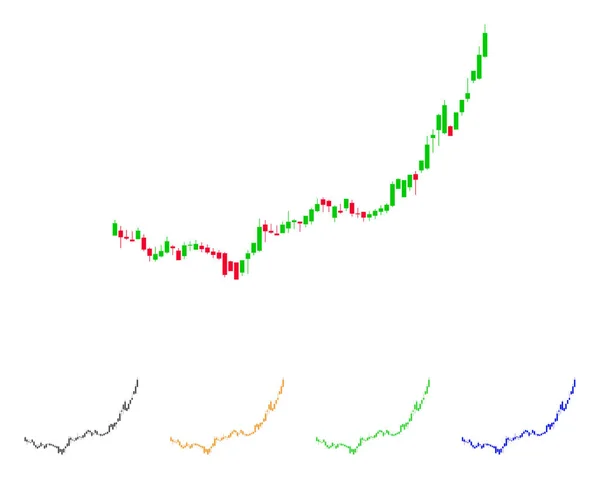
Line Mosaic Based On Candlestick Chart Growth Acceleration Icon. Mosaic Vector Candlestick Chart Growth Acceleration Is Created With Random Line Items. Bonus Icons Are Added.
Vector, 0.43MB, 4875 × 3282 eps

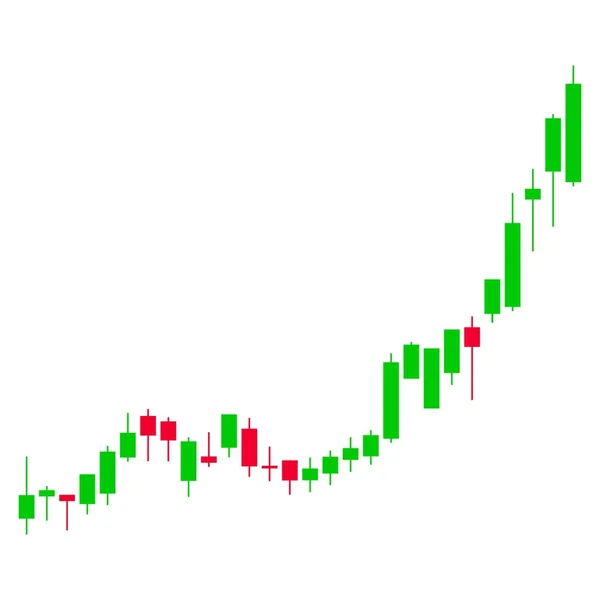
Candle Stick Graph Trading Chart To Analyze The Trade In The Foreign Exchange And Stock Market, Icon - Stock Vector
Vector, 2.37MB, 4171 × 4171 eps


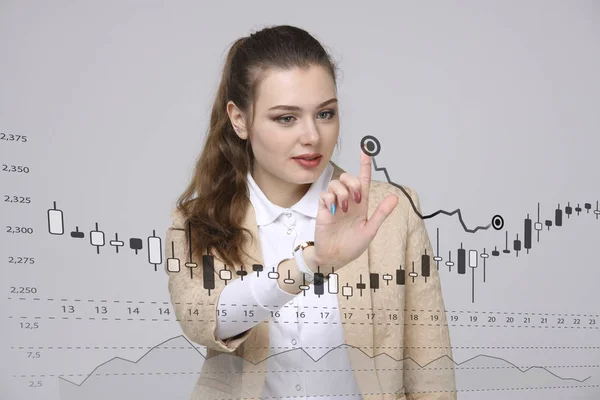
Finance Data Concept. Woman Working With Analytics. Chart Graph Information With Japanese Candles On Digital Screen.
Image, 8.33MB, 5616 × 3744 jpg

Isometric Stock Exchange Building. Outline Bank. Vector Illustration. Business Finance District. Display Of Changes Of Stock Market Quotes. Japanese Candles. Financial Market. Forex.
Vector, 3.29MB, 8150 × 3364 eps

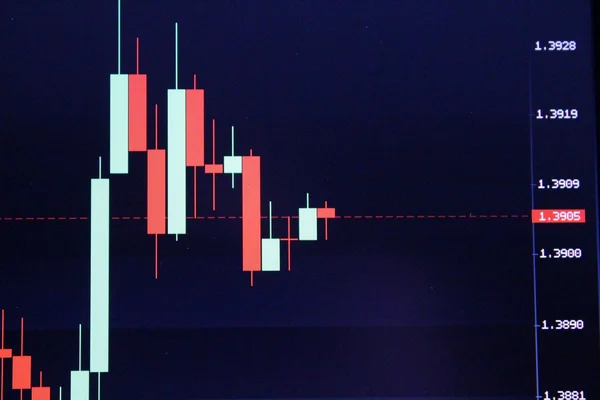
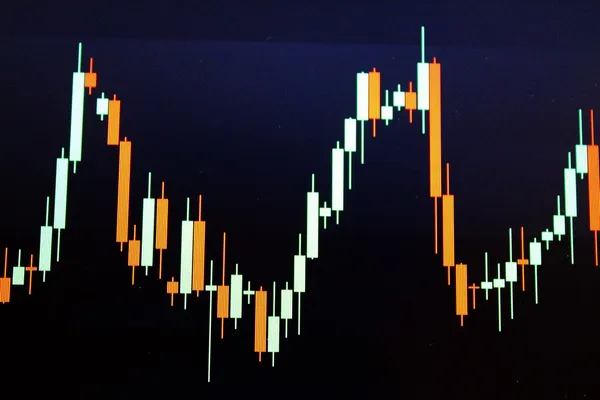
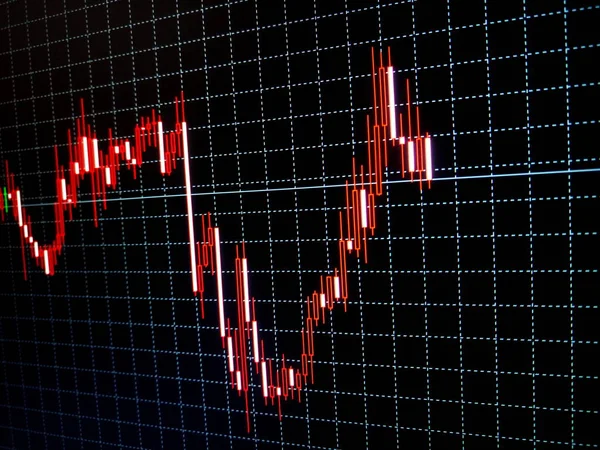
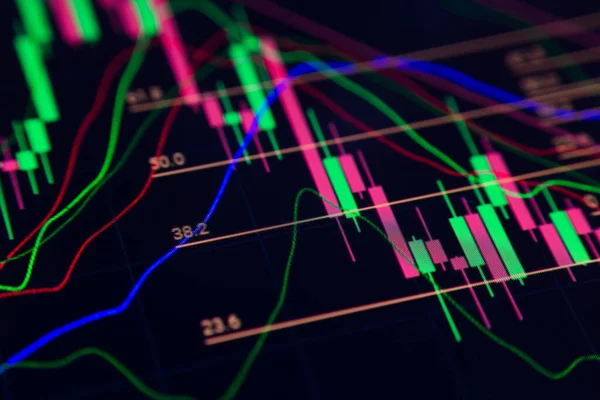
Forex Chart With Oscillators And Indicators And Japanese Candlesticks On A Black Background With The Effect Of Blurring And Bokeh, Analysis Of The Securities And Futures Market
Image, 5.46MB, 4500 × 3000 jpg


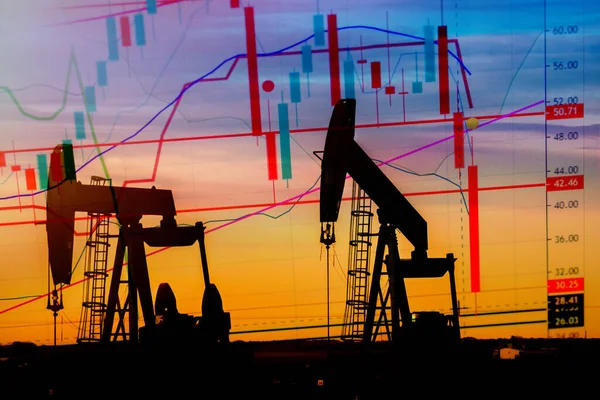
Explicit Illustration Depicting The Historic Fall In The Price Of Oil With An Oil Well In Silhouette In The Background
Image, 2.32MB, 3000 × 2000 jpg
Finance Data Concept. Woman Working With Analytics. Chart Graph Information With Japanese Candles On Digital Screen.
Image, 6.55MB, 4752 × 3168 jpg

A Tablet Or Multi-colored Pills On A Light Background Of A Graph With Japanese Candles, The Concept Of Changes In Drug Prices During The Coronavirus Pandemic, 3d Rendering
Image, 4.11MB, 4800 × 3200 jpg

A Tablet Or Multi-colored Pills On A Dark Background Of A Graph With Japanese Candles, The Concept Of Changes In Drug Prices During The Coronavirus Pandemic, 3d Rendering
Image, 3.95MB, 4800 × 3200 jpg


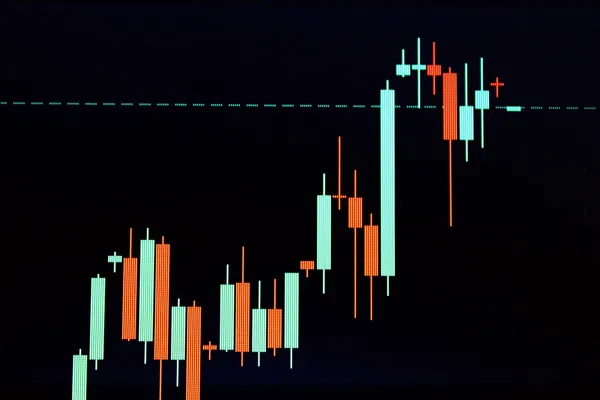

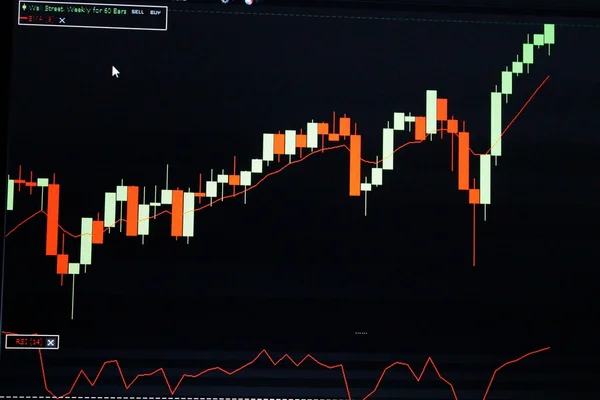
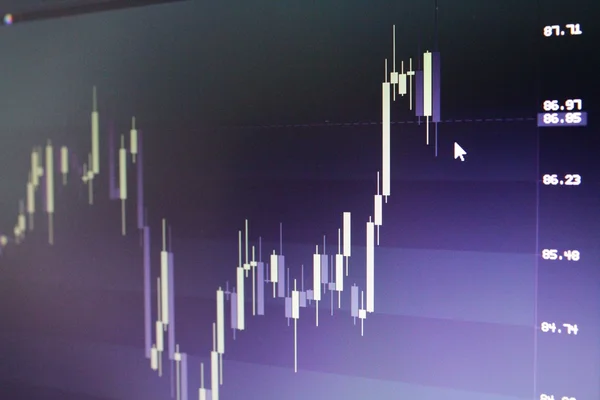
Forex Chart With Oscillators And Indicators And Japanese Candlesticks On A Black Background With The Effect Of Blurring And Bokeh, Analysis Of The Securities And Futures Market
Image, 4.32MB, 4500 × 3000 jpg


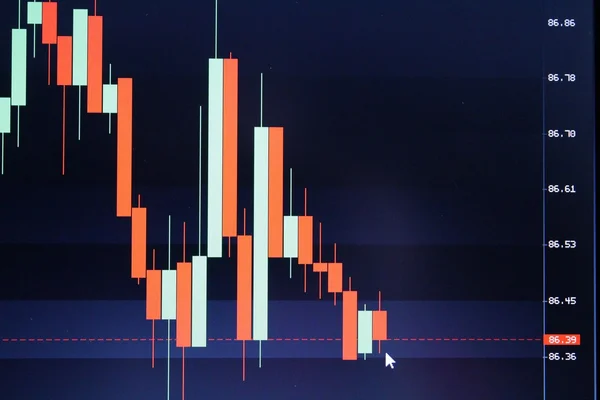
Close Up On Japanese Stock Market Candles Showing A Large Drop Magnified With A Magnifying Glass
Image, 1.75MB, 3000 × 2000 jpg


A Tablet Or Multi-colored Pills On A Light Background Of A Graph With Japanese Candles, The Concept Of Changes In Drug Prices During The Coronavirus Pandemic, 3d Rendering
Image, 3.95MB, 4800 × 3200 jpg
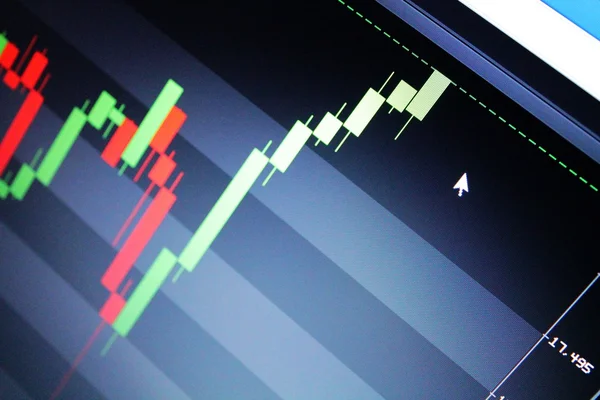
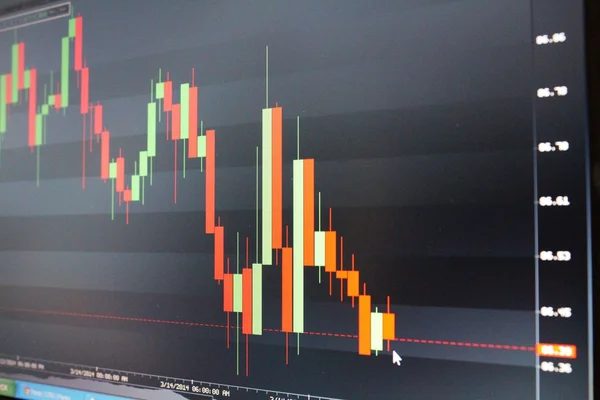
Forex Chart With Oscillators And Indicators And Japanese Candlesticks On A Black Background With The Effect Of Blurring And Bokeh, Analysis Of The Securities And Futures Market
Image, 5.71MB, 4500 × 3000 jpg

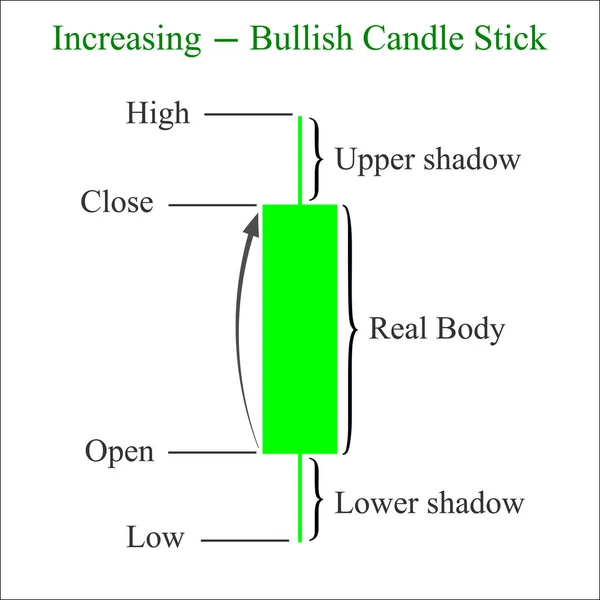
Candlestick On A White Background. Display Of Stock Market Quotes. Investment Trading In The Stock Market. Vector Illustration.
Vector, 0.82MB, 8000 × 4848 eps

Vector Realistic Blank Flipchart With Japanese Candles Isolated On White Background. Forex Trading Training.
Vector, 2.93MB, 4718 × 4717 eps


Page 1 >> Next