photo free
Home Images Vectors Videos

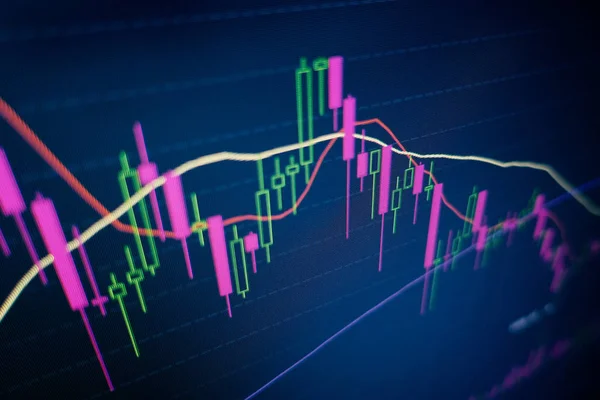
Stock image Stock market exchange loss trading graph analysis investment indicator business graph charts of financial board display candlestick crisis stock crash red price chart fall money

Stock image Stock market exchange loss trading graph analysis investment indicator business graph charts of financial board display candlestick crisis stock crash red price chart fall money
Published: Apr.29, 2020 11:59:32
Author: poringdown@gmail.com
Views: 31
Downloads: 5
File type: image / jpg
File size: 8.08 MB
Orginal size: 6016 x 4016 px
Available sizes:
S
(500 x 334)
M
(1000 x 668)
L
(2000 x 1335)
XL
(6016 x 4016)
EL0
(6016 x 4016)
Level: bronze
Download Image
Image topics:

Similar stock images

stock image Index graph of stock market financial indicator analysis on LED.

Index Graph Of Stock Market Financial Indicator Analysis On LED.

5184 × 3213
stock image Image of financial data processing and stock market over empty office. global business, finances and data processing concept digitally generated image.

Image Of Financial Data Processing And Stock Market Over Empty Office. Global Business, Finances And Data Processing Concept Digitally Generated Image.

4096 × 2160
stock image Stock market graph trading analysis investment financial, stock exchange financial or forex graph stock market graph chart business crisis crash and grow up gain and profits

Stock Market Graph Trading Analysis Investment Financial, Stock Exchange Financial Or Forex Graph Stock Market Graph Chart Business Crisis Crash And Grow Up Gain And Profits

6016 × 4016
stock image Stock market exchange loss trading graph analysis investment indicator business graph charts of financial board display candlestick crisis stock crash red price chart fall money

Stock Market Exchange Loss Trading Graph Analysis Investment Indicator Business Graph Charts Of Financial Board Display Candlestick Crisis Stock Crash Red Price Chart Fall Money

6016 × 4016
stock image Stock graph charts on the stock market exchange price with investment of business financial digital background / Candle stick stock or forex trading indicator on computer monitor for investors

Stock Graph Charts On The Stock Market Exchange Price With Investment Of Business Financial Digital Background / Candle Stick Stock Or Forex Trading Indicator On Computer Monitor For Investors

6016 × 4016
stock image 3D rendering of stock indexes in virtual space. Economic growth, recession. Electronic virtual platform showing trends and stock market fluctuations

3D Rendering Of Stock Indexes In Virtual Space. Economic Growth, Recession. Electronic Virtual Platform Showing Trends And Stock Market Fluctuations

3840 × 2160
stock image Stock market graph chart - stock exchange trading analysis investment financial display stock crisis crash down and grow up trand profits financial or forex graph stock market digital graph business

Stock Market Graph Chart - Stock Exchange Trading Analysis Investment Financial Display Stock Crisis Crash Down And Grow Up Trand Profits Financial Or Forex Graph Stock Market Digital Graph Business

6016 × 4016
stock image Stock Market fluctuation

Stock Market Fluctuation

5472 × 3648