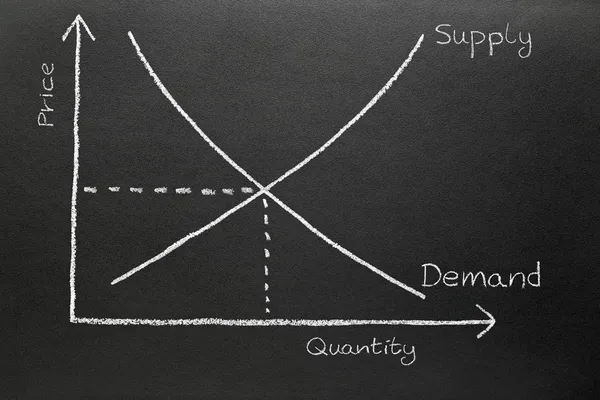
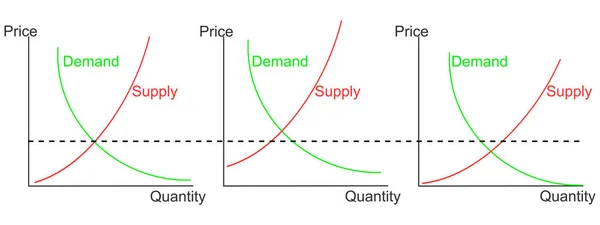
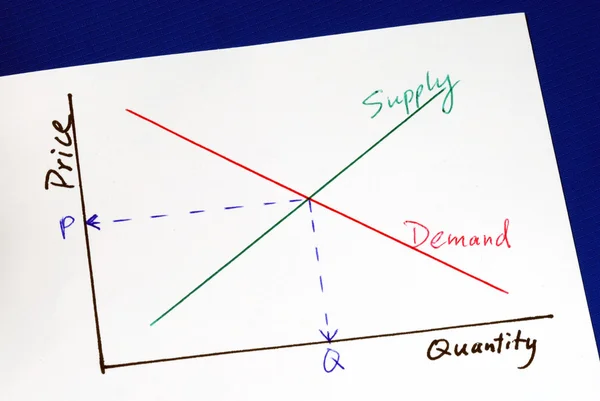
Stock image Supply and demand curves
Published: May.11, 2010 10:57:12
Author: johnkwan
Views: 487
Downloads: 32
File type: image / jpg
File size: 4.15 MB
Orginal size: 3872 x 2592 px
Available sizes:
Level: silver