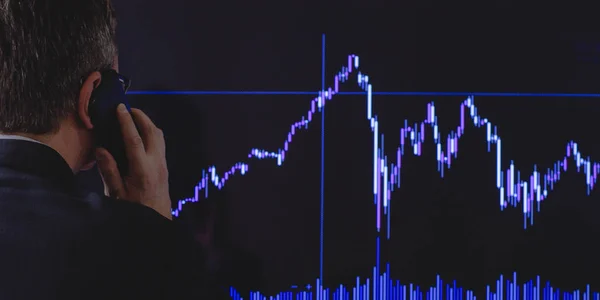
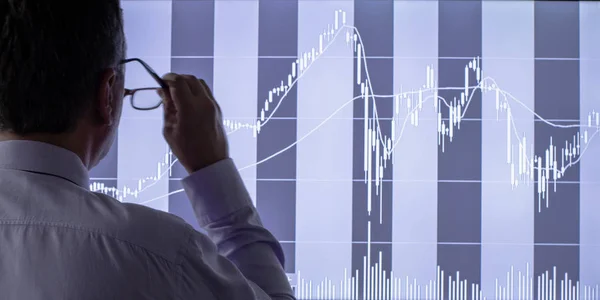
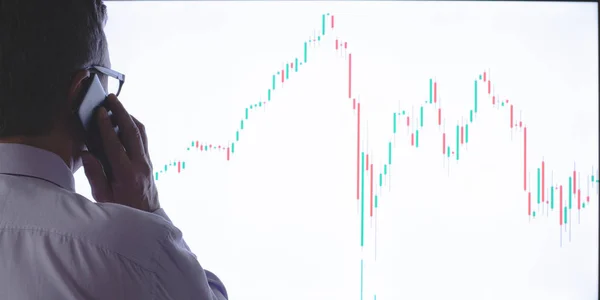
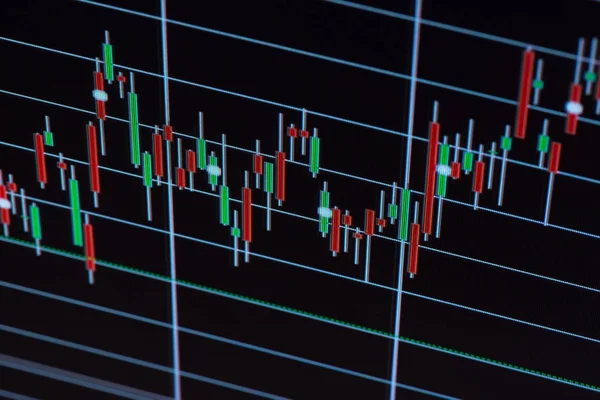
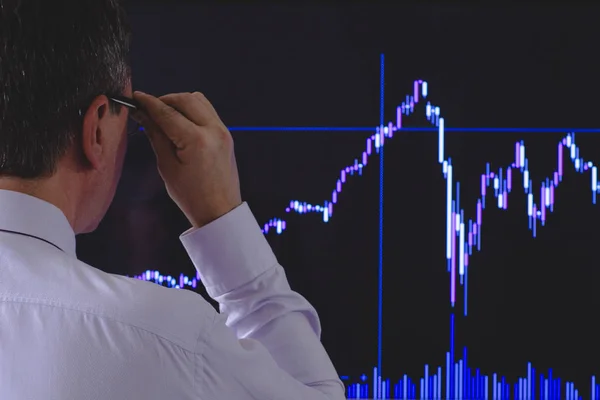
Stock image The investor is looking at a volatile chart of stock indexes. A black day on the stock exchange and falling quotes.
Published: Nov.05, 2018 21:19:14
Author: zoommachine
Views: 22
Downloads: 5
File type: image / jpg
File size: 2.97 MB
Orginal size: 2770 x 1846 px
Available sizes:
Level: beginner
Similar stock images
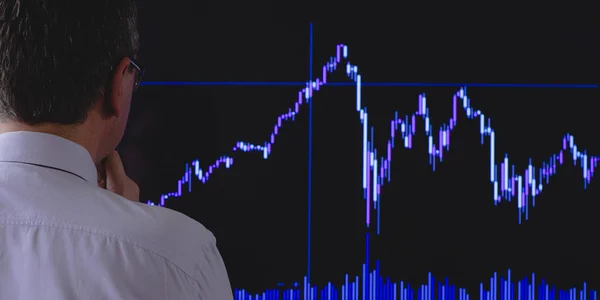
The Investor Analyzes The Stock Index Quotes Chart. A Black Day On The Stock Exchange And Falling Quotes.
3430 × 1715