
Stock image Technical Analysis

ANALYSIS. Magnifying Glass Over Seamless Background With Different Association Terms.
Vector, 0.89MB, 2400 × 2400 eps


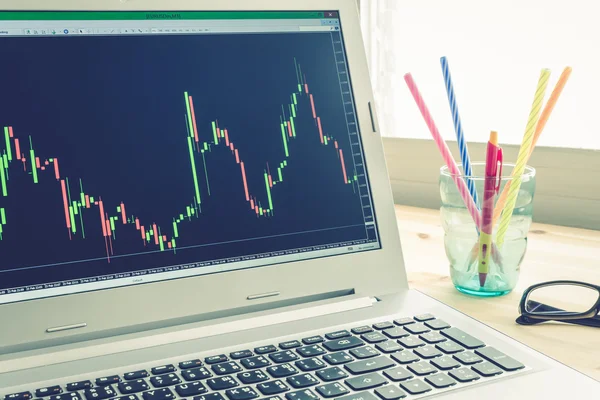
Stock Or Forex Graph In Laptop Screen On Left View On Blue Vintage Style
Image, 4.37MB, 4272 × 2848 jpg

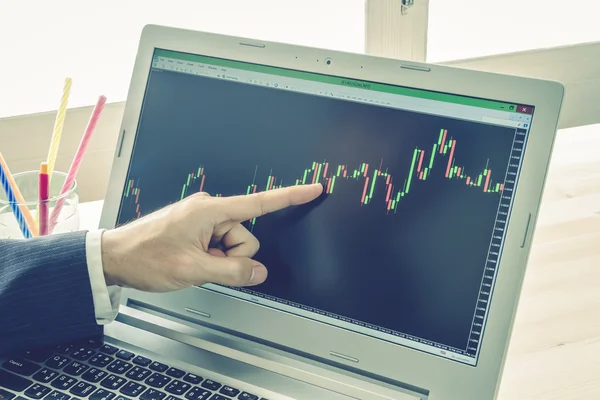
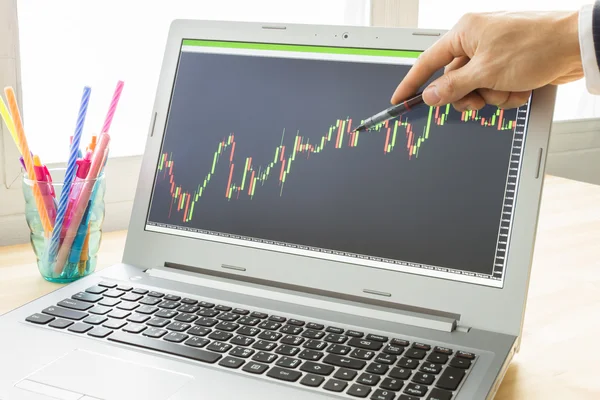
Businessman Point And Analyze Forex Graph Or Stock Graph On Blue Vintage Style
Image, 4.56MB, 4272 × 2848 jpg
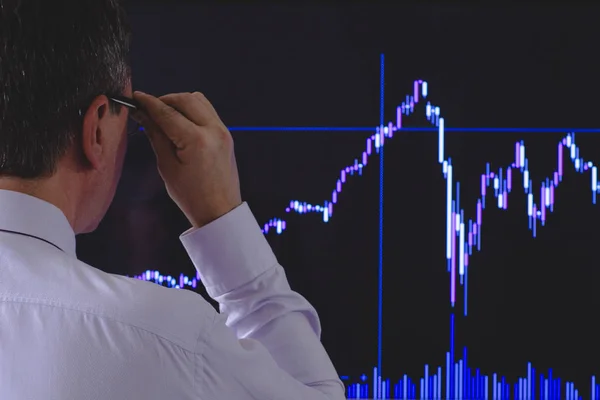
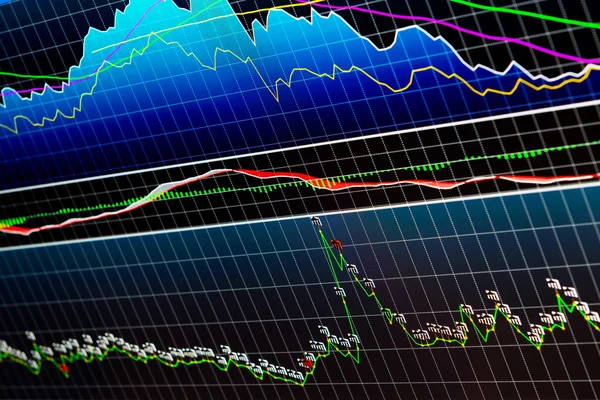
The Investor Is Looking At A Volatile Chart Of Stock Indexes. A Black Day On The Stock Exchange And Falling Quotes.
Image, 2.97MB, 2770 × 1846 jpg

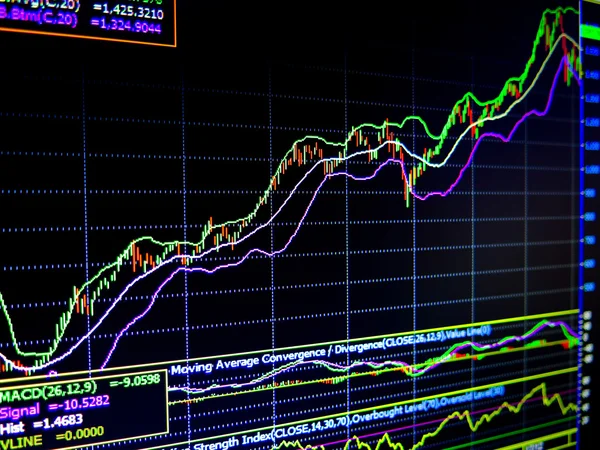
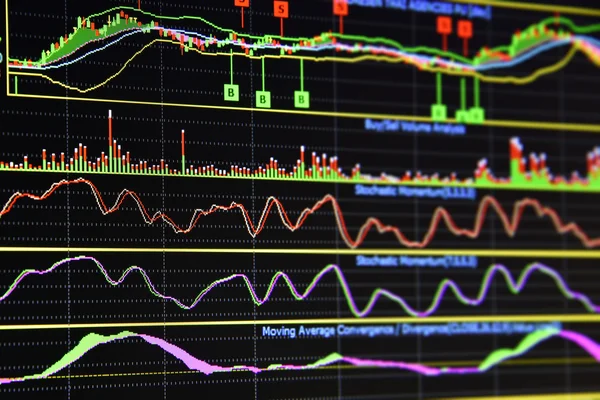
Technical Analysis Of A Financial Instrument With Software For Trading
Image, 3.44MB, 3050 × 2036 jpg

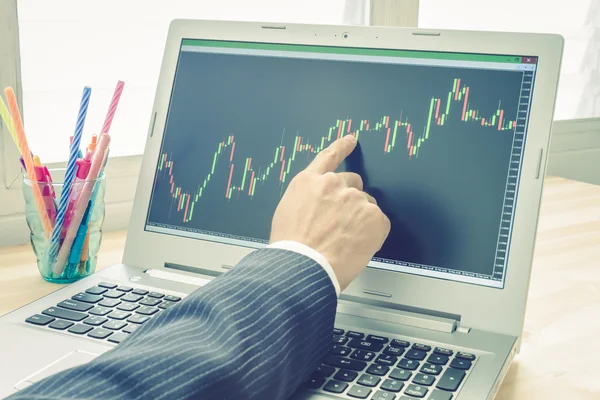
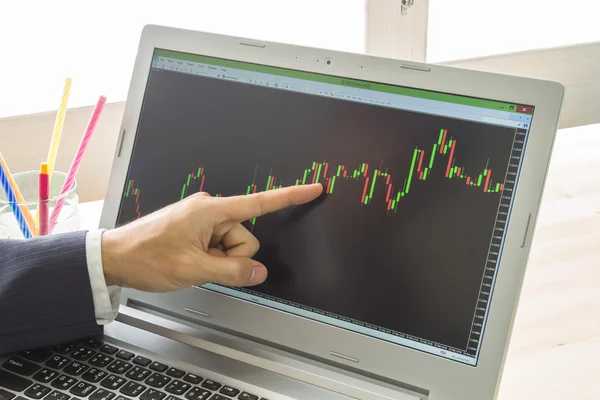
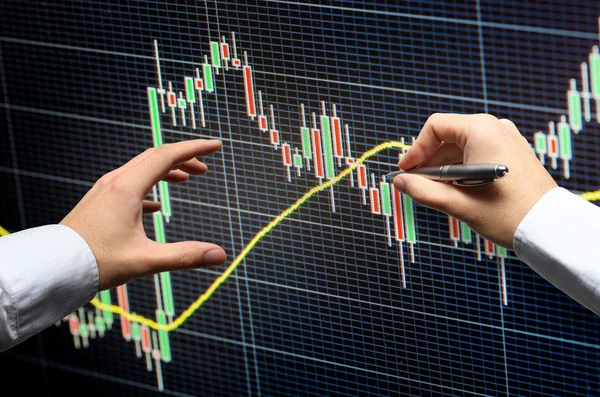
Businessman Point And Analyze Forex Graph Or Stock Graph By Right Finger
Image, 4.23MB, 4272 × 2848 jpg
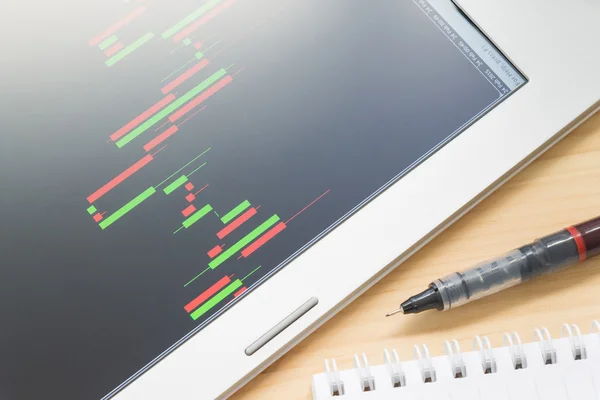
Stock Or Forex Graph Or Candlestick Chart In Tablet Screen And Pen And Notebook
Image, 4.46MB, 4272 × 2848 jpg

Exchange Analysis Financial Candlestick Chart. Vector Money Stock Trade, Business Finance Market Analysis Illustration
Vector, 3.64MB, 5315 × 5315 eps


Double Exposure Of Businessman Working With Laptop In Office And Business Chart With Financial Graphs
Image, 4.89MB, 4500 × 3000 jpg

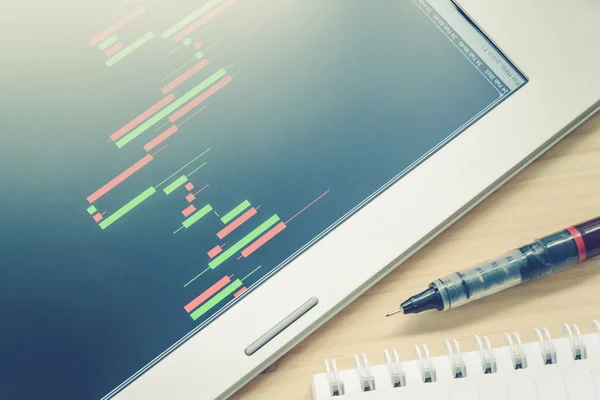
Stock Or Forex Graph Or Candlestick Chart In Tablet Screen And Pen And Notebook
Image, 4.96MB, 4272 × 2848 jpg


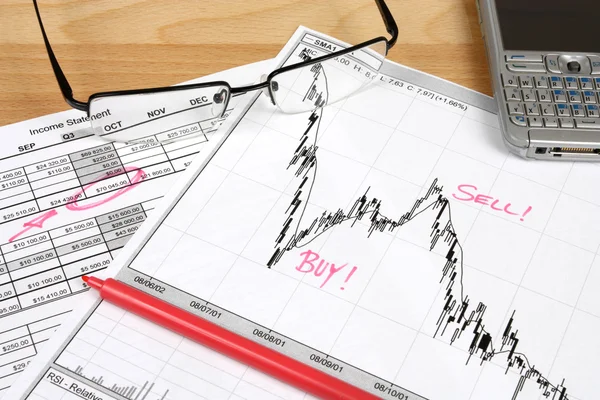
Stock Market Candle Charts, Remarks With A Red Marker, Glasses And Mobile Smart Phone
Image, 3.8MB, 4272 × 2848 jpg

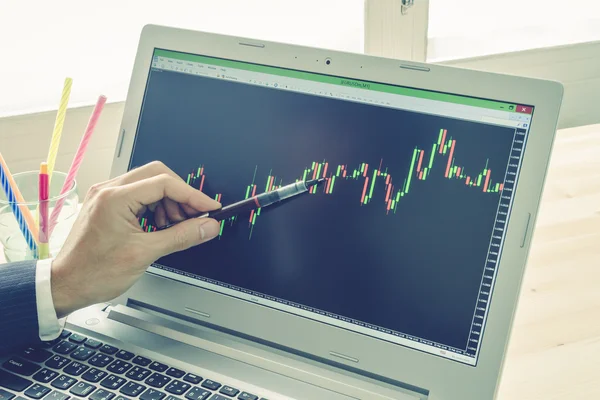
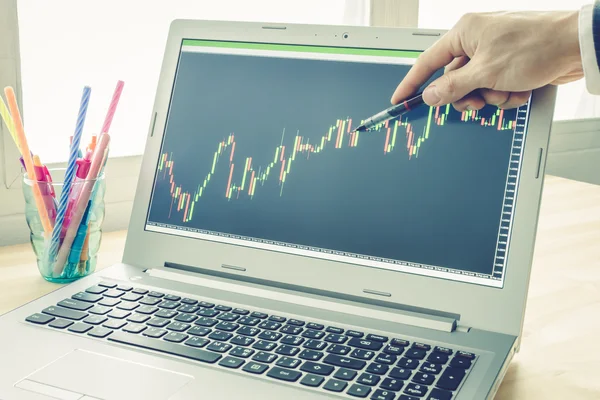
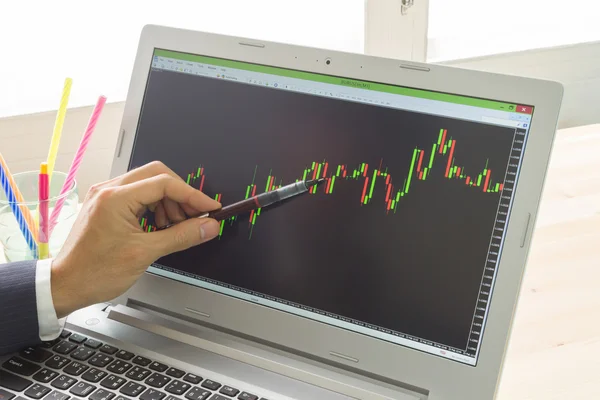
Businessman Point And Analyze Forex Graph Or Stock Graph By Pen On Blue Vintage Style
Image, 4.66MB, 4272 × 2848 jpg

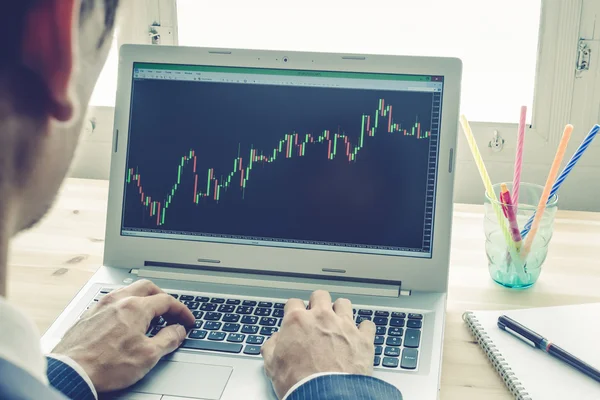
Businessman Analyze Stock Graph Or Forex Graph By Laptop Vintage Style
Image, 4.29MB, 4272 × 2848 jpg
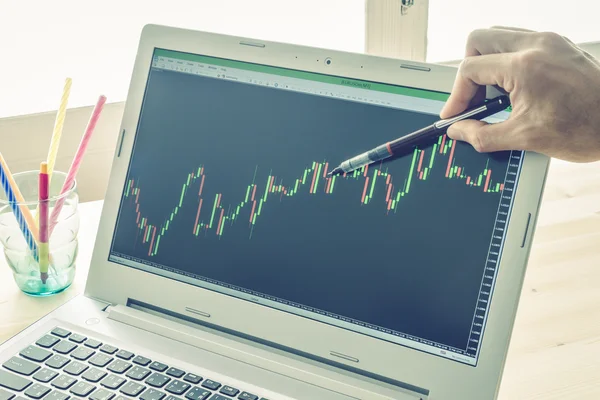
Businessman Point And Analyze Forex Graph Or Stock Graph By Use Pen In Right Hand On Blue Vintage Style
Image, 4.72MB, 4272 × 2848 jpg


A Trader Analyzes Candlestick Charts Of Crypto In A Smartphone Application
Image, 0.57MB, 3840 × 2160 jpg
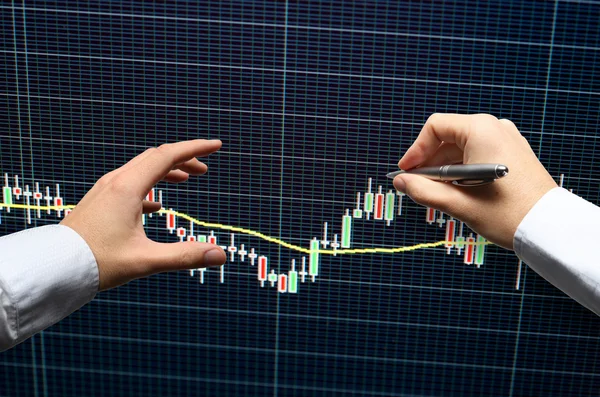
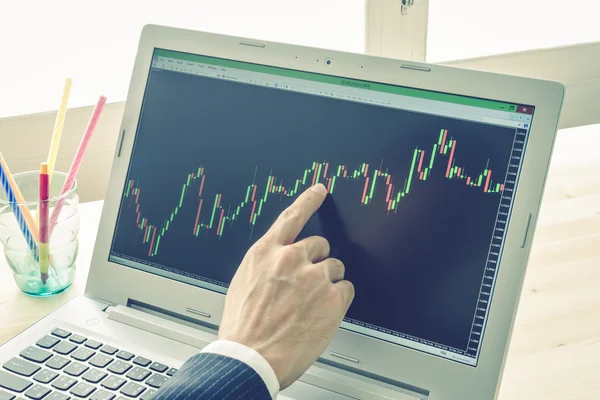
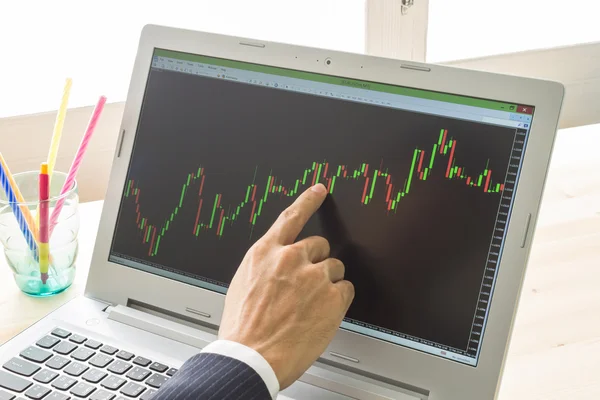
Businessman Point And Analyze Forex Graph Or Stock Graph By Right Finger On Blue Vintage Style
Image, 4.29MB, 4272 × 2848 jpg

Page 1 >> Next