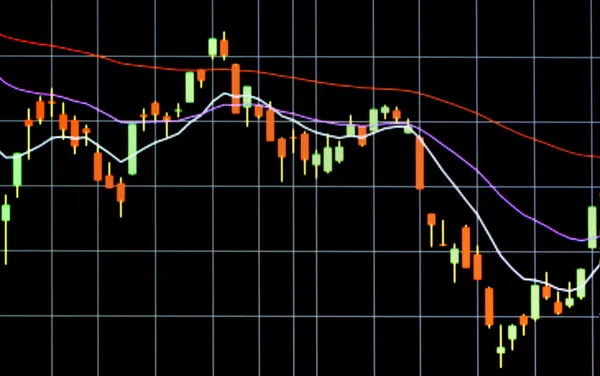
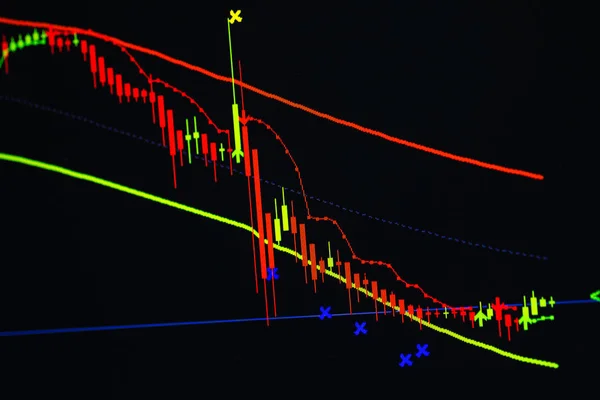
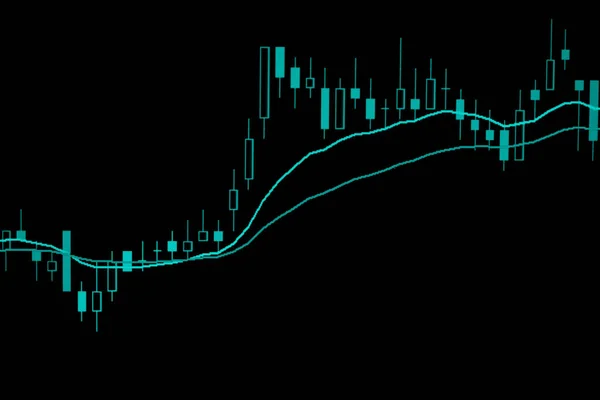
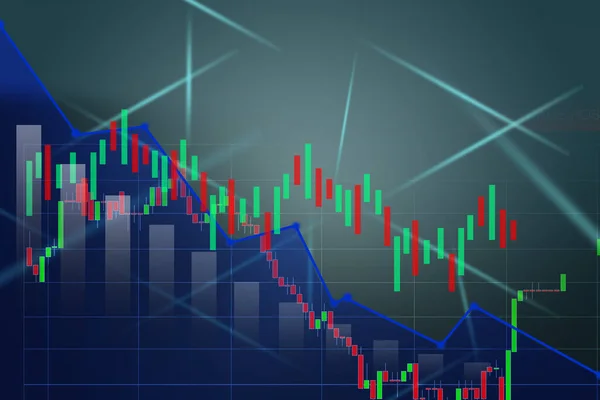
Stock image The market volatility of crypto trading with technical graph and indicator, red and green candlesticks, for analysis up and downtrend. Cryptocurrency background concept. Focus part of candlesticks.
Published: Mar.10, 2022 08:52:47
Author: artitwpd
Views: 3
Downloads: 1
File type: image / jpg
File size: 5.04 MB
Orginal size: 5168 x 2912 px
Available sizes:
Level: bronze