photo free
Home Images Vectors Videos

Stock vector Candle stick graph trading chart to analyze the trade in the foreign exchange and stock market, icon - stock vector
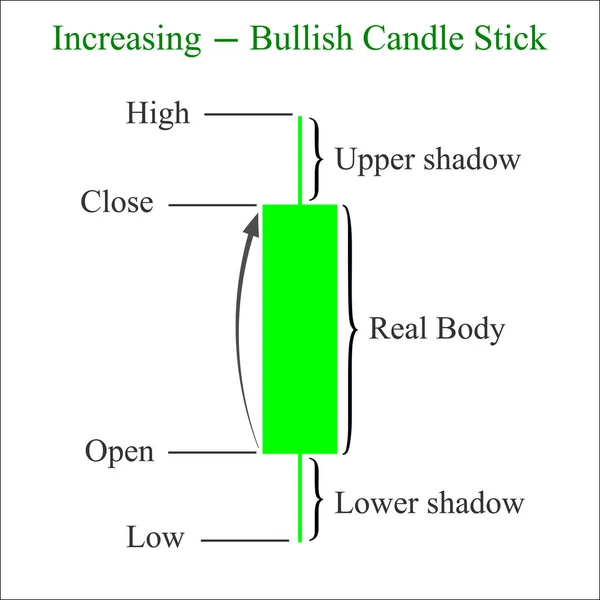
Stock vector Candle stick graph trading chart to analyze the trade in the foreign exchange and stock market, icon - stock vector
Published: Nov.20, 2018 07:34:53
Author: Dlyastokiv
Views: 42
Downloads: 2
File type: vector / eps
File size: 2.37 MB
Orginal size: 4171 x 4171 px
Available sizes:
S
(500 x 500)
M
(1000 x 1000)
L
(2000 x 2000)
XL
(4171 x 4171)
VECT
(4171 x 4171)
EL0
(4171 x 4171)
Level: beginner
Download Vector
Vector topics:

Similar stock vectors

stock vector Simple template of Japanese candlestick chart components part. Bullish and Bearish system  design. Stock, crypto,  and forex investment trading analysis.

Simple Template Of Japanese Candlestick Chart Components Part. Bullish And Bearish System Design. Stock, Crypto, And Forex Investment Trading Analysis.

4180 × 2240
stock vector Japanese candlestick chart components part template. Bullish and Bearish system  design. Crypto, stock and forex investment trading analysis.

Japanese Candlestick Chart Components Part Template. Bullish And Bearish System Design. Crypto, Stock And Forex Investment Trading Analysis.

4180 × 2240
stock vector buy signal candle stick

Buy Signal Candle Stick

3333 × 2000
stock vector Thrusting Pattern (-) Green & Red - Square

Thrusting Pattern (-) Green & Red - Square

11111 × 11111
stock vector After Bottom Gap Up Pattern (+) White & Black - Square

After Bottom Gap Up Pattern (+) White & Black - Square

11111 × 11111
stock vector Upside Gap Three Methods Pattern (+) Green & Red - Round

Upside Gap Three Methods Pattern (+) Green & Red - Round

11111 × 11111
stock vector After Top Gap Down Pattern (-) White & Black - Square

After Top Gap Down Pattern (-) White & Black - Square

11111 × 11111
stock vector Two Black Gapping Candles Pattern (-) Green & Red - Round

Two Black Gapping Candles Pattern (-) Green & Red - Round

11111 × 11111