Home
Images
Vectors
Videos
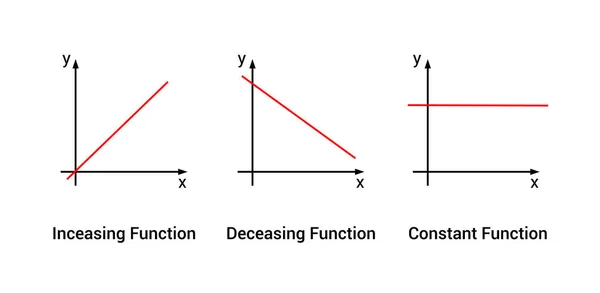
Stock vector increasing decreasing and constant graphs
Published:
Mar.18, 2022 07:32:56
Author:
zizou07
Views:
1
Downloads:
0
File type:
vector
/
eps
File size:
5.31 MB
Orginal size:
7106
x
3475
px
Available sizes:
S
(500 x 245)
M
(1000 x 489)
L
(2000 x 978)
XL
(7106 x 3475)
VECT
(7106 x 3475)
EL0
(7106 x 3475)
Level:
beginner
Download Vector
Vector topics:
Vector
Background
Money
Graphic
Illustration
Design
Business
Financial
Market
Sign
Art
Growth
Abstract
Line
Arrow
Concept
Icon
Data
Presentation
Education
Investment
Finance
Range
Science
Economy
Graph
Value
Chart
Mathematics
Progress
Educational
Profit
Domain
Linear
Diagram
Interval
Practice
Example
Maths
Math
Statistic
Notation
Determine
Function
Worksheet
Increasing
Constant
Decreasing
Linear Function
Constant Function
Similar stock vectors
Graphic Presentation For Constant Linear Absolute Value And Quadratic Functions Graph
5000 × 5000
A Table Showing The Roots Of A Quadratic Equation For Discriminant Values Less Than, Greater Than, And Equal To Zero
3200 × 4800
Graph. Simple Orthogonal Coordinate Plane With Axes X And Y. Vector Illustration Isolated On White Background.
4167 × 4167
Graph Or Chart Of Absolute Value Or Modulus Function, 3d Rendering
6000 × 4000
Cube Graph. Simple Orthogonal Coordinate Plane With Axes X And Y. Vector Illustration Isolated On White Background.
4167 × 4167
Graphical Representation Of The Roots Of A Quadratic Equation For Three Different Values Of The Discriminants
4800 × 3200
Table Of Graphs Of Exponential And Logarithmic Functions In Red
3900 × 3900
Snell's Law Formula. Law Of Refraction
5000 × 5000