Home
Images
Vectors
Videos
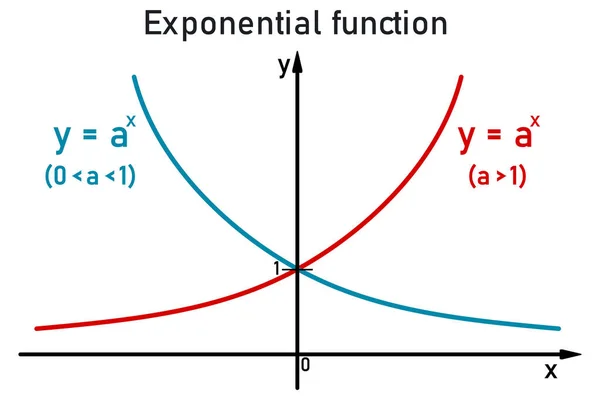
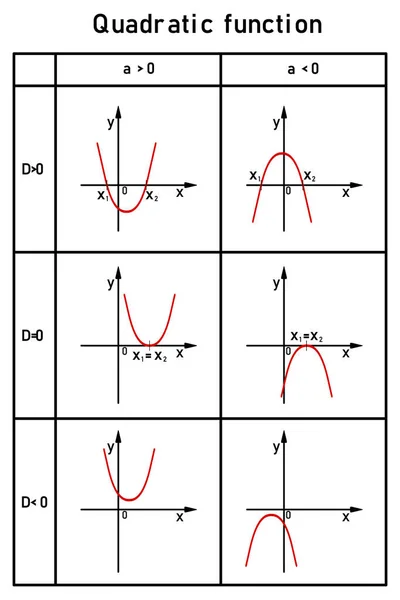
Stock vector Table of graphs of exponential and logarithmic functions in red
Published:
Jun.18, 2023 20:02:35
Author:
Radicik
Views:
2
Downloads:
0
File type:
vector
/
eps
File size:
1.75 MB
Orginal size:
3900
x
3900
px
Available sizes:
S
(500 x 500)
M
(1000 x 1000)
L
(2000 x 2000)
XL
(3900 x 3900)
VECT
(3900 x 3900)
EL0
(3900 x 3900)
Level:
beginner
Download Vector
Vector topics:
Vector
Graphic
Colored
Illustration
Design
Shape
Formula
Symbol
Creative
Concept
Construction
School
Drawing
Information
Presentation
Education
Template
Geometric
Science
Learn
Solution
Geometry
Study
Knowledge
Graph
Chart
Teach
Mathematics
Teacher
Diagram
Calculate
Calculation
Definition
Maths
Demonstration
Axis
Even
Math
Function
Chalkboard
Equation
Logarithmic
School Board
Exponential Function
Exponential Graph
Logarithmic Function
Similar stock vectors
Graphic Presentation For Constant Linear Absolute Value And Quadratic Functions Graph
5000 × 5000
Graphs Of The Exponential Function On The Number Line, Blue For Base "a" From Zero To One, Red For Base "a" Greater Than One
4800 × 3200
Graphical Representation And Comparison Of Logarithmic And Exponential Functions Distinguished By Blue And Red Colors
4800 × 3200
Graphs Of A Logarithmic Function On A Number Line, Red For Base Zero To One, Blue For Base Greater Than One
3900 × 3900
A Table Showing The Roots Of A Quadratic Equation For Discriminant Values Less Than, Greater Than, And Equal To Zero
3200 × 4800
Increasing Decreasing And Constant Graphs
7106 × 3475
The Basic Properties Of Linear Functions On The Coordinate Axis, On The Green Board
3900 × 3900
The Basic Properties Of Linear Functions On The Coordinate Axis
3900 × 3900