Home
Images
Vectors
Videos
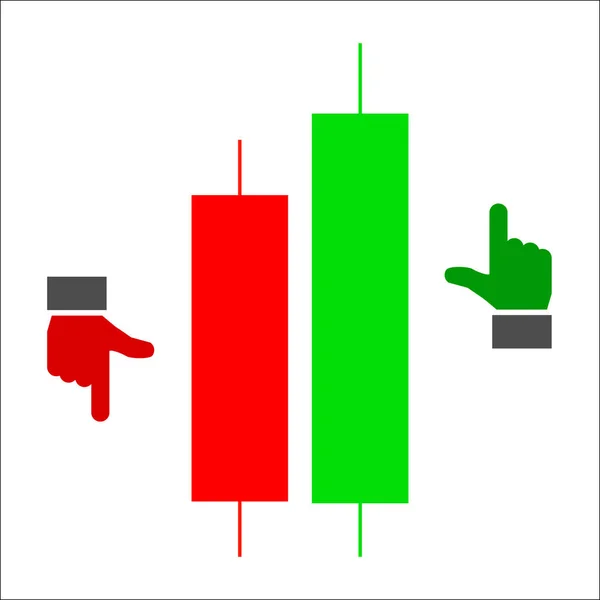
Stock vector Morning Star candlestick chart pattern. Set of candle stick. Candle stick graph trading chart to analyze the trade in the foreign exchange and stock market. Forex market. Forex trading. Japanese candles.
Published:
Nov.20, 2018 07:35:16
Author:
Dlyastokiv
Views:
312
Downloads:
3
File type:
vector
/
eps
File size:
2.25 MB
Orginal size:
4171
x
4171
px
Available sizes:
S
(500 x 500)
M
(1000 x 1000)
L
(2000 x 2000)
XL
(4171 x 4171)
VECT
(4171 x 4171)
EL0
(4171 x 4171)
Level:
beginner
Download Vector
Vector topics:
Bar
Vector
Money
Illustration
Business
Market
Model
Success
Morning
Risk
Close
Change
Line
Open
Star
Icon
Wall
Price
Candle
Data
Currency
Exchange
Investment
Finance
Stock
Strategy
History
Report
Tail
Technical
Research
Loss
Index
Analysis
Graph
Chart
Candlestick
Trade
Scheme
Profit
Diagram
Broker
Trend
Prognosis
Forex
Regularity
Japanese Candles
Similar stock vectors
Internet Business Concept. On The Background Of Interactive Forex Charts There Is A Marker And A Sticker With The Inscription - Morning Star
5906 × 3898
Raster Flat Candlestick Chart Icon
3529 × 4534
Here Is A Modern Stock Market Chart, Graph. This Is An Illustration.
13200 × 9000
Stocks Investment Money Growth Savings 3d Render Illustration
5000 × 3000
Stock Market Crash Icon. Monochrome Sign From Economic Crisis Collection. Creative Stock Market Crash Icon Illustration For Web Design, Infographics And More
5000 × 5000
Here Is A Modern Stock Market Chart, Graph. This Is An Illustration.
13200 × 9000
Stock Market Crash Concept Line Icon. Simple Element Illustration. Stock Market Crash Concept Outline Symbol Design. Can Be Used For Web And Mobile
5556 × 5556
Candle Stick Graph Trading Chart To Analyze The Trade In The Foreign Exchange And Stock Market. Forex Market. Forex Trading. Japanese Candles.
4171 × 4171