Home
Images
Vectors
Videos
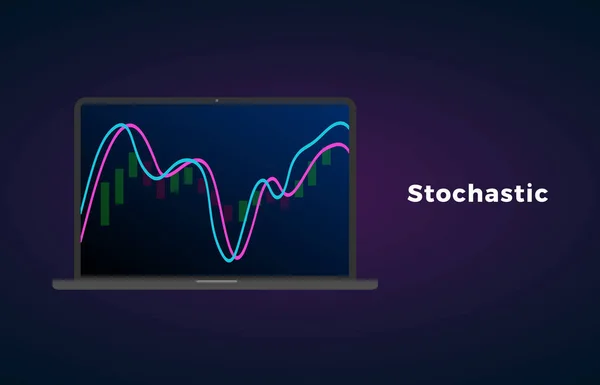
Stock vector Stochastic indicator oscillator technical analysis. Vector stock and cryptocurrency exchange graph, forex analytics and trading market chart on laptop display screen
Published:
Apr.18, 2019 11:10:54
Author:
bestforbest
Views:
32
Downloads:
4
File type:
vector
/
eps
File size:
2.9 MB
Orginal size:
5000
x
3214
px
Available sizes:
S
(500 x 321)
M
(1000 x 643)
L
(2000 x 1286)
XL
(5000 x 3214)
VECT
(5000 x 3214)
EL0
(5000 x 3214)
Level:
bronze
Download Vector
Vector topics:
Background
Money
Business
Financial
Market
Trading
Growth
Concept
Price
Candle
Digital
Data
Currency
Exchange
Investment
Finance
Stock
Stick
Technical
Analysis
Graph
Chart
Economic
Profit
Indicator
Forex
Oscillator
Stochastic
Cryptocurrency
Similar stock vectors
Stochastic Oscillator Technical Analysis Indicator On Stock Market, Forex And Cryptocurrency Trading Exchange Market. Laptop Display Screen With Graph And Candle Stick
5000 × 3214
Creative Website Banner
5000 × 3000
Bollinger Bands Technical Analysis Indicator Cloud On Stock Market, Forex And Cryptocurrency Trading Exchange Market. Laptop Display Screen With Graph And Candle Stick
5000 × 3214
Bullish Rectangle - Continuation Price Chart Pattern Vector Icon. Figure Technical Analysis. Strong Uptrend Between Two Parallel Levels. Stock, Cryptocurrency Graph, Forex Analytics
5000 × 3216
Candle Stick Graph Chart Of Stock Market Investment Trading, Stock Exchange Concept Design And Background. Vector Illustrations.
7500 × 5000
Online Stock Trading Platform Concept For Template Of Banners, Flyer, Books, And Magazine Cover Vector Illustration
5000 × 6200
Bullish Rectangle - Continuation Price Chart Pattern Vector Icon. Figure Technical Analysis. Strong Uptrend Between Two Parallel Levels. Stock, Cryptocurrency Graph, Forex Analytics
5000 × 3216
Investment Funding Isometric Composition
4500 × 4500