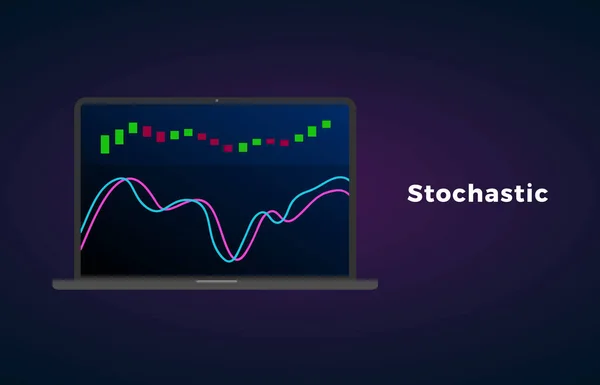
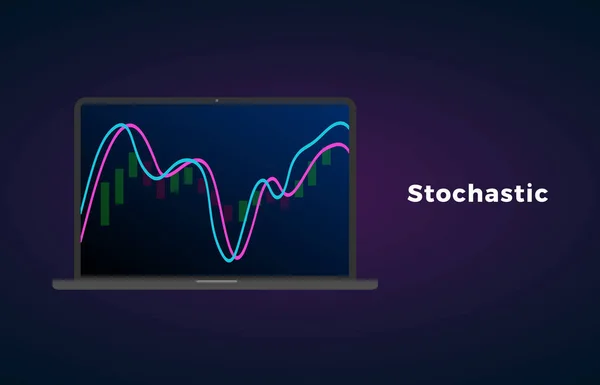
Stock vector Stochastic oscillator technical analysis indicator on stock market, forex and cryptocurrency trading exchange market. Laptop display screen with graph and candle stick
Published: Apr.12, 2019 14:13:16
Author: bestforbest
Views: 30
Downloads: 5
File type: vector / eps
File size: 3.01 MB
Orginal size: 5000 x 3214 px
Available sizes:
Level: bronze