photo free
Home Images Vectors Videos

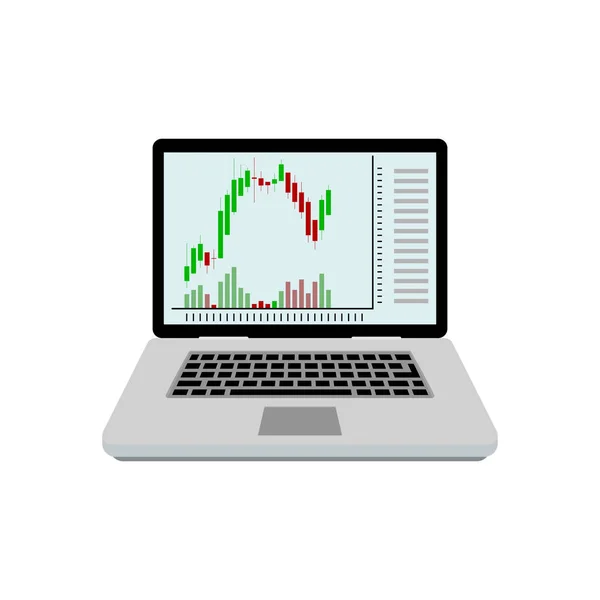
Stock vector Stock chart of candle stick on laptop. Vector stock graph investment, bullish amd bearish strategy technical illustration

Stock vector Stock chart of candle stick on laptop. Vector stock graph investment, bullish amd bearish strategy technical illustration
Published: Jun.25, 2018 15:08:35
Author: 09910190
Views: 1
Downloads: 0
File type: vector / eps
File size: 3.34 MB
Orginal size: 5315 x 5315 px
Available sizes:
S
(500 x 500)
M
(1000 x 1000)
L
(2000 x 2000)
XL
(5315 x 5315)
VECT
(5315 x 5315)
EL0
(5315 x 5315)
Level: beginner
Download Vector
Vector topics:

Similar stock vectors

stock vector Candlestick chart on screen laptop. Play trade strategy, technical growth currency online, vector illustration

Candlestick Chart On Screen Laptop. Play Trade Strategy, Technical Growth Currency Online, Vector Illustration

5315 × 5315
stock vector laptop with forex chart on desktop.

Laptop With Forex Chart On Desktop.

6000 × 6000
stock vector Display with Candlestick Trading Chart, Stock Market symbol. Fla

Display With Candlestick Trading Chart, Stock Market Symbol. Fla

5000 × 5000
stock vector Candle stick graph chart of stock market investment trading. Vector illustration

Candle Stick Graph Chart Of Stock Market Investment Trading. Vector Illustration

4167 × 4167
stock vector candlestick chart and diagram in the laptop

Candlestick Chart And Diagram In The Laptop

5538 × 4000
stock vector Display with Candlestick Trading Chart, Stock Market symbol. Fla

Display With Candlestick Trading Chart, Stock Market Symbol. Fla

5000 × 5000
stock vector Trade. Trading stocks on the computer. Stock market candlestick chart or forex trading chart. Online analysis for investments. Financial analytics. Vector illustration

Trade. Trading Stocks On The Computer. Stock Market Candlestick Chart Or Forex Trading Chart. Online Analysis For Investments. Financial Analytics. Vector Illustration

5557 × 3125
stock image Trade. Trading stocks on the computer. Stock market candlestick chart or forex trading chart. Online analysis for investments. Financial analytics. Vector illustration

Trade. Trading Stocks On The Computer. Stock Market Candlestick Chart Or Forex Trading Chart. Online Analysis For Investments. Financial Analytics. Vector Illustration

5557 × 3125