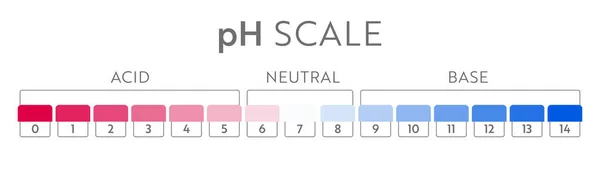
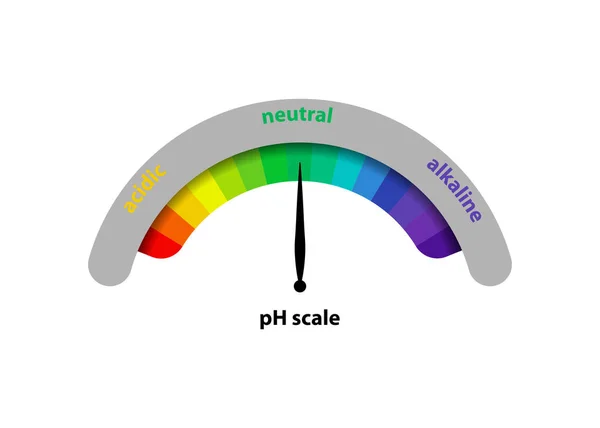
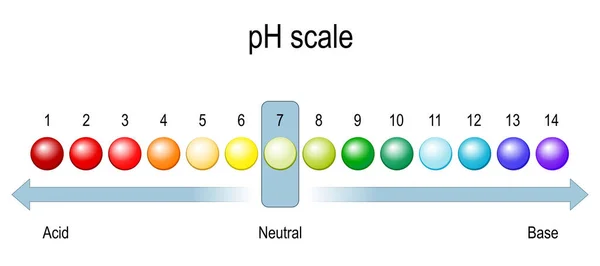
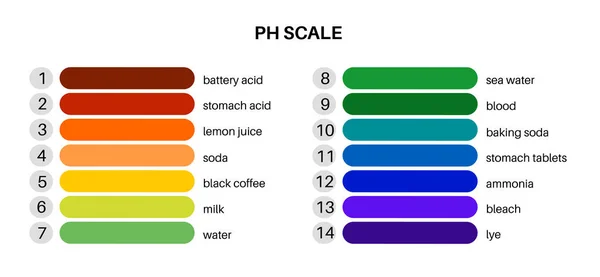
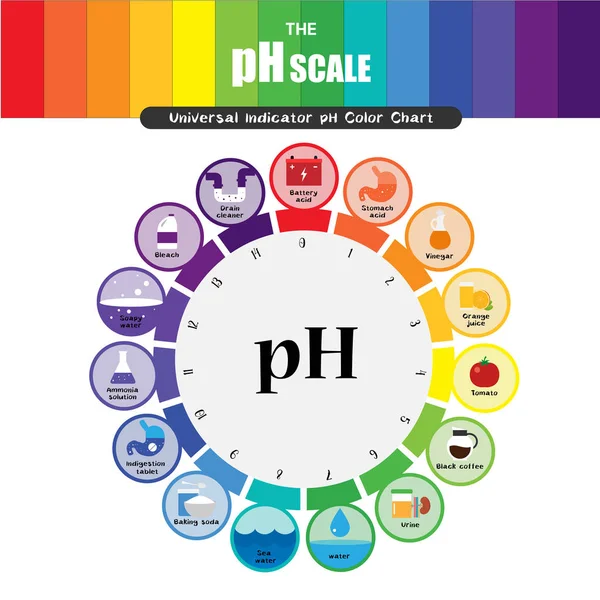
Stock vector The Ph scale infographic. Isolated vector illustration on white background.

Published: Nov.26, 2021 15:09:35
Author: dashka703
Views: 1
Downloads: 0
File type: vector / eps
File size: 7.72 MB
Orginal size: 6000 x 2000 px
Available sizes:
Level: beginner