photo free
Home Images Vectors Videos

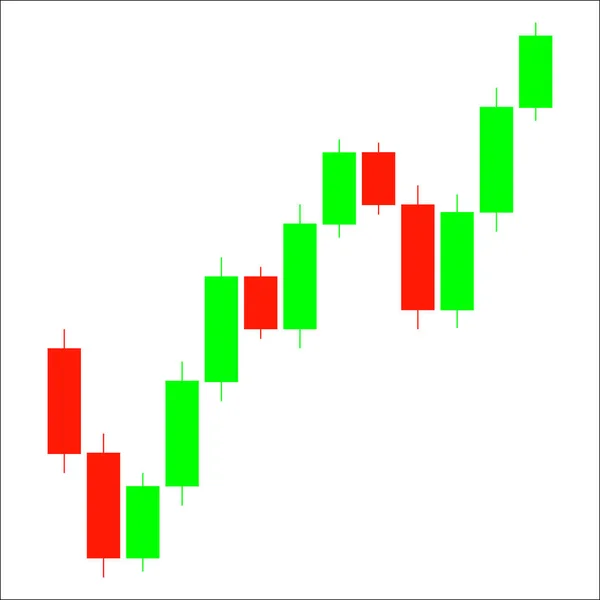
Stock vector Trade of stock. Financial chart to buy and sell for stock exchange market concept. Chart of trade with candles. Vector illustration.

Stock vector Trade of stock. Financial chart to buy and sell for stock exchange market concept. Chart of trade with candles. Vector illustration.
Published: Dec.02, 2021 08:33:05
Author: olehsvetiukha@gmail.com
Views: 1
Downloads: 0
File type: vector / eps
File size: 1.85 MB
Orginal size: 5000 x 5000 px
Available sizes:
S
(500 x 500)
M
(1000 x 1000)
L
(2000 x 2000)
XL
(5000 x 5000)
VECT
(5000 x 5000)
EL0
(5000 x 5000)
Level: bronze
Download Vector
Vector topics:

Similar stock vectors

stock image 3d rendering candlestick chart isolate on white background. illustration of financial and stock markets in minimal style concept.

3d Rendering Candlestick Chart Isolate On White Background. Illustration Of Financial And Stock Markets In Minimal Style Concept.

6000 × 4000
stock vector Chart of the rise of trading with candles for the analysis of trading on the cryptocurrency and stock markets

Chart Of The Rise Of Trading With Candles For The Analysis Of Trading On The Cryptocurrency And Stock Markets

4000 × 4000
stock image candlestick chart isolated over white

Candlestick Chart Isolated Over White

6000 × 4000
stock image Raster Flat Candlestick Chart Icon

Raster Flat Candlestick Chart Icon

3529 × 4534
stock image An illustration of a three dimensional red-green candlestick chart on a white background - 3d render

An Illustration Of A Three Dimensional Red-green Candlestick Chart On A White Background - 3d Render

6000 × 3000
stock vector Trading candles background

Trading Candles Background

4134 × 4134
stock vector Candle trading chart to analyze the trade in the foreign exchange and stock market

Candle Trading Chart To Analyze The Trade In The Foreign Exchange And Stock Market

4171 × 4171
stock vector Star bottom candlestick chart pattern. Candle stick graph trading chart to analyze the trade in the foreign exchange and stock market. Forex market. Forex trading. Japanese candles.

Star Bottom Candlestick Chart Pattern. Candle Stick Graph Trading Chart To Analyze The Trade In The Foreign Exchange And Stock Market. Forex Market. Forex Trading. Japanese Candles.

4171 × 4171