photo free
Home Images Vectors Videos

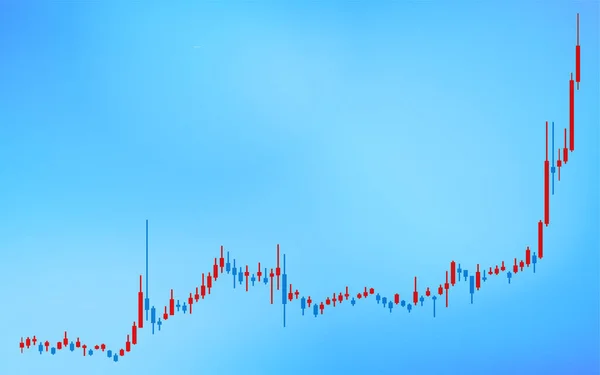
Stock vector With candlestick chart, rise, magnifying glass used for stocks, FX and virtual currencies

Stock vector With candlestick chart, rise, magnifying glass used for stocks, FX and virtual currencies
Published: Apr.13, 2021 06:53:56
Author: t_k_m
Views: 4
Downloads: 3
File type: vector / ai
File size: 0.04 MB
Orginal size: 5334 x 3334 px
Available sizes:
S
(500 x 313)
M
(1000 x 625)
L
(2000 x 1250)
XL
(5334 x 3334)
VECT
(5334 x 3334)
EL0
(5334 x 3334)
Level: bronze
Download Vector
Vector topics:

Similar stock vectors

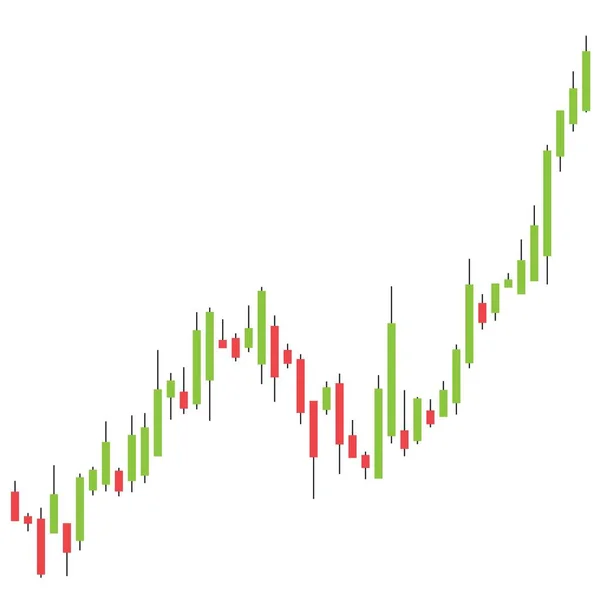
stock vector Candlestick graph. Stock market trading chart, also used for currency and crypto markets. Up trend - bullish uptrend. Market going up.

Candlestick Graph. Stock Market Trading Chart, Also Used For Currency And Crypto Markets. Up Trend - Bullish Uptrend. Market Going Up.

4550 × 4550
stock vector abstract background of magnifying glass stock market on white background

Abstract Background Of Magnifying Glass Stock Market On White Background

6000 × 3375
stock vector Candlestick charts used for stocks, Forex and cryptocurrencies, rising, white background

Candlestick Charts Used For Stocks, Forex And Cryptocurrencies, Rising, White Background

5334 × 3334
stock vector Candlestick charts used for stocks, Forex and cryptocurrencies, rising, blue background

Candlestick Charts Used For Stocks, Forex And Cryptocurrencies, Rising, Blue Background

5334 × 3334
stock image The airline concept fell out on white background. The white plane landed. The green and red bars indicate stock trading. 3D Rendering

The Airline Concept Fell Out On White Background. The White Plane Landed. The Green And Red Bars Indicate Stock Trading. 3D Rendering

5000 × 3000
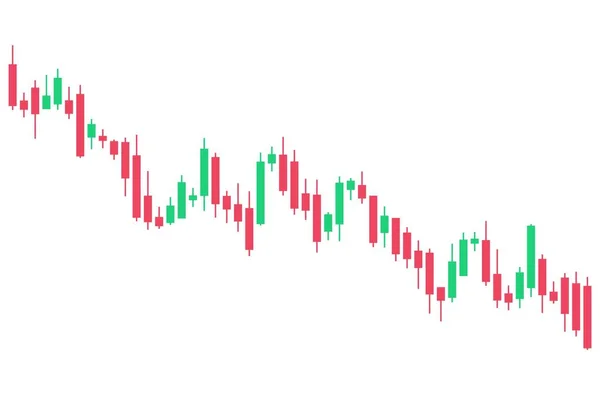
stock image Candlestick chart showing downtrend market, concept. 3D rendering isolated on white background

Candlestick Chart Showing Downtrend Market, Concept. 3D Rendering Isolated On White Background

8000 × 5300
stock vector Candle stick chart (also called Japanese candlestick chart) for forex trading, stock exchange and crypto price analysis.

Candle Stick Chart (also Called Japanese Candlestick Chart) For Forex Trading, Stock Exchange And Crypto Price Analysis.

5700 × 3800
stock image An illustration of a three dimensional red-green candlestick chart on a white background - 3d render

An Illustration Of A Three Dimensional Red-green Candlestick Chart On A White Background - 3d Render

6000 × 4000