
Stock image Dax Background
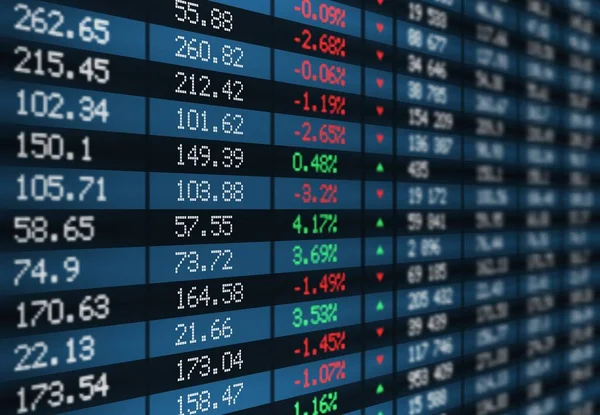
Stock Exchange Board Vector Display With Financial Market Index Charts And Graphs. Stock Market Ticker Screen With Green And Red Numbers Of Share Volume, Price Traded, Change Direction, Economy Themes
Vector, 12.91MB, 6360 × 4403 eps

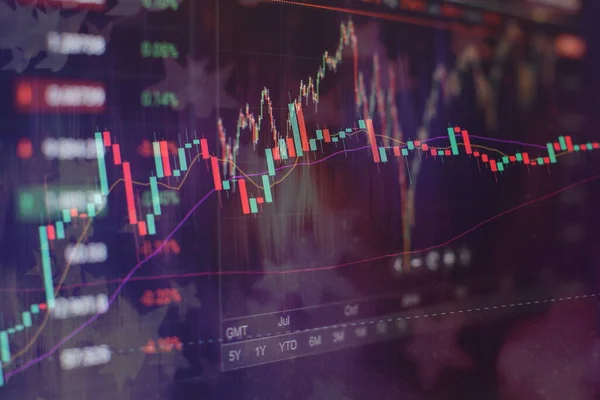
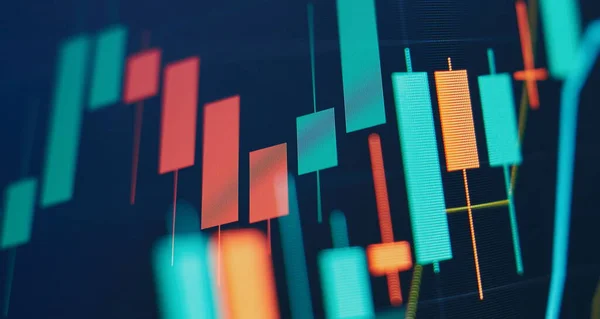
Technical Price Graph And Indicator, Red And Green Candlestick Chart On Blue Theme Screen, Market Volatility, Up And Down Trend. Stock Trading, Crypto Currency Background.
Image, 7.87MB, 5315 × 3543 jpg
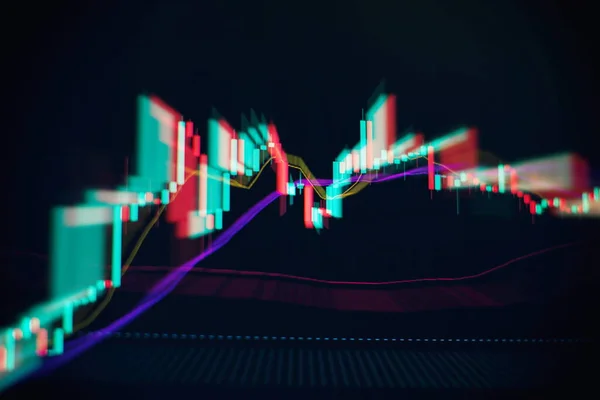
Technical Price Graph And Indicator, Red And Green Candlestick Chart On Blue Theme Screen, Market Volatility, Up And Down Trend. Stock Trading, Crypto Currency Background.
Image, 3.93MB, 5315 × 3543 jpg
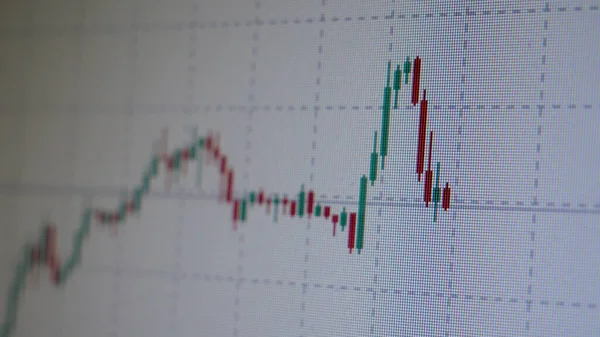
A Quick Price Movement In The Form Of Candles On Stock Chart On The Screen
Image, 2.61MB, 3840 × 2160 jpg


Stock Market Indexes Concept: Painted Green Text DAX On Black Brick Wall Background With Tag Cloud
Image, 0MB, 3600 × 2700 jpg
Technical Price Graph And Indicator, Red And Green Candlestick Chart On Blue Theme Screen, Market Volatility, Up And Down Trend. Stock Trading, Crypto Currency Background.
Image, 8.98MB, 13000 × 4000 jpg

Stock Index On The Computer Monitor . Financial Data On A Monitor Which Including Of Market Analyze. Bar Graphs, Diagrams, Financial Figures.
Image, 16.58MB, 8858 × 4724 jpg

Digital Graph Interface Over Dark Blue Background. Concept Of Stock Market And Financial Success.
Image, 2.95MB, 8858 × 4724 jpg
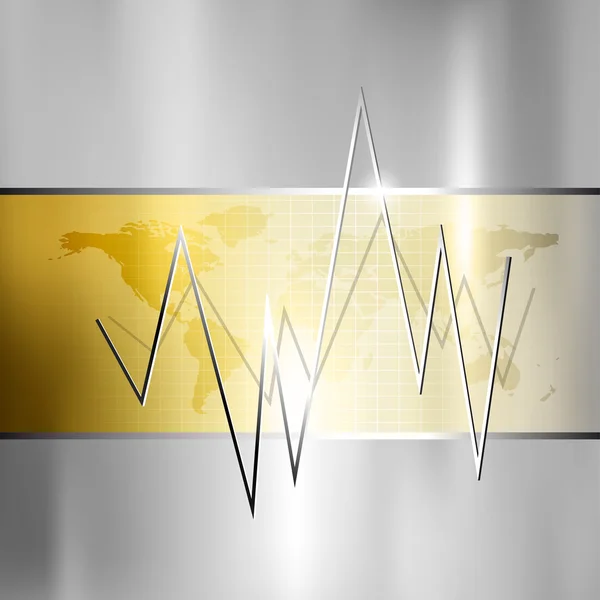
Finance Background - Stock Market Graph - Silver Gold Business Chart
Vector, 12.01MB, 5000 × 5000 eps

Technical Price Graph And Indicator, Red And Green Candlestick Chart On Blue Theme Screen, Market Volatility, Up And Down Trend. Stock Trading, Crypto Currency Background.
Image, 10.81MB, 13000 × 4000 jpg

Business Success And Growth Concept.Stock Market Business Graph Chart On Digital Screen.Forex Market, Gold Market And Crude Oil Market .
Image, 1.86MB, 3543 × 2362 jpg

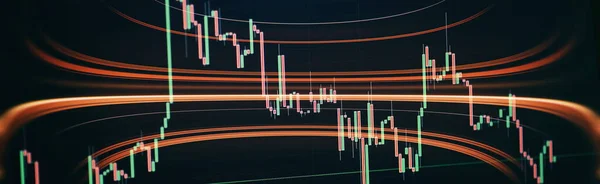
Graph And Indicator, Red And Green Candlestick Chart On Blue Theme Screen, Market Volatility, Up And Down Trend. Stock Trading
Image, 17.48MB, 10039 × 3543 jpg


Business Success And Growth Concept.Stock Market Business Graph Chart On Digital Screen.Forex Market, Gold Market And Crude Oil Market .
Image, 2.34MB, 5472 × 3648 jpg


Forex Trading Graph And Candlestick Chart Suitable For Financial Investment Concept. Economy Trends Background For Business Idea And All Art Work Design. Abstract Finance Background.
Image, 8.05MB, 8858 × 4724 jpg

Technical Price Graph And Indicator, Red And Green Candlestick Chart On Blue Theme Screen, Market Volatility, Up And Down Trend. Stock Trading, Crypto Currency Background.
Image, 8.91MB, 5472 × 3648 jpg


Blurry Growing Digital Graph Interface Over Dark Blue Background. Concept Of Stock Market And Financial
Image, 6.75MB, 8858 × 4724 jpg

Technical Price Graph And Indicator, Red And Green Candlestick Chart On Blue Theme Screen, Market Volatility, Up And Down Trend. Stock Trading, Crypto Currency Background.
Image, 22.62MB, 8858 × 4724 jpg

Financial Chart With Pen, Stock Analysis Data For Business Background On Digital Screen. Graphs Of The Growth Of The Financial Market Forex. Trading Candlestick Chart
Image, 9.13MB, 8858 × 4724 jpg


Monitor With Stock Data, Closeup. Financial Trading Concept Concept Of Financial Data On A Monitor. Display Of Stock Market Quotes On Dark Background.
Image, 6.57MB, 7680 × 4320 jpg

Economy Trends Background For Business Idea And All Art Work Design. Abstract Finance Background.
Image, 6.01MB, 5315 × 3543 jpg
Technical Price Graph And Indicator, Red And Green Candlestick Chart On Blue Theme Screen, Market Volatility, Up And Down Trend. Stock Trading, Crypto Currency Background.
Image, 11.9MB, 8858 × 4724 jpg

Technical Price Graph And Indicator, Red And Green Candlestick Chart On Blue Theme Screen, Market Volatility, Up And Down Trend. Stock Trading, Crypto Currency Background.
Image, 6.64MB, 13000 × 4000 jpg

Technical Price Graph And Indicator, Red And Green Candlestick Chart On Blue Theme Screen, Market Volatility, Up And Down Trend. Stock Trading, Crypto Currency Background.
Image, 7.79MB, 8268 × 4724 jpg

DAX Is The Most Important Stock Index In Germany, Gold Letters On A Dark Background With Red And Green Bars With A Chart With Japanese Candlesticks, 3D Rendering
Image, 3MB, 4000 × 2600 jpg

Business Success And Growth Concept.Stock Market Business Graph Chart On Digital Screen.Forex Market, Gold Market And Crude Oil Market .
Image, 5.33MB, 5315 × 3543 jpg
Stock Index On The Computer Monitor . Financial Data On A Monitor Which Including Of Market Analyze. Bar Graphs, Diagrams, Financial Figures.
Image, 22.14MB, 8858 × 4724 jpg

Technical Price Graph And Indicator, Red And Green Candlestick Chart On Blue Theme Screen
Image, 22.84MB, 9803 × 4488 jpg

Monitor With Stock Data, Closeup. Financial Trading Concept Concept Of Financial Data On A Monitor. Display Of Stock Market Quotes On Dark Background.
Image, 8.13MB, 7680 × 4320 jpg

Blurry Growing Digital Graph Interface Over Dark Blue Background. Concept Of Stock Market And Financial
Image, 5.03MB, 8858 × 4724 jpg

Blurry Growing Digital Graph Interface Over Dark Blue Background. Concept Of Stock Market And Financial
Image, 9.68MB, 8858 × 4724 jpg

Economy Trends Background For Business Idea And All Art Work Design. Abstract Finance Background.
Image, 5.95MB, 5472 × 3648 jpg

National Flag Of Germany With A Large Display Of Daily Stock Market Price And Quotations.
Image, 5.97MB, 6016 × 4016 jpg
Price Graph And Indicator, Red And Green Candlestick Chart On Blue Theme Screen, Market Volatility, Up And Down Trend.
Image, 12.83MB, 9803 × 4488 jpg

Technical Price Graph And Indicator, Red And Green Candlestick Chart On Blue Theme Screen, Market Volatility, Up And Down Trend. Stock Trading, Crypto Currency Background.
Image, 5.1MB, 5315 × 3543 jpg

Monitor With Stock Data, Closeup. Financial Trading Concept Concept Of Financial Data On A Monitor. Display Of Stock Market Quotes On Dark Background.
Image, 10.11MB, 7680 × 4320 jpg

Financial Chart With Pen, Stock Analysis Data For Business Background On Digital Screen. Graphs Of The Growth Of The Financial Market Forex. Trading Candlestick Chart
Image, 11.1MB, 8858 × 4724 jpg

Technical Price Graph And Indicator, Red And Green Candlestick Chart On Blue Theme Screen, Market Volatility, Up And Down Trend. Stock Trading, Crypto Currency Background.
Image, 5.37MB, 13000 × 4000 jpg
Page 1 >> Next