
Stock image Dax Background page 2


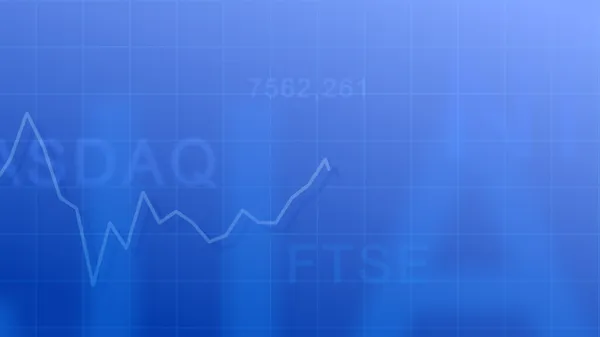
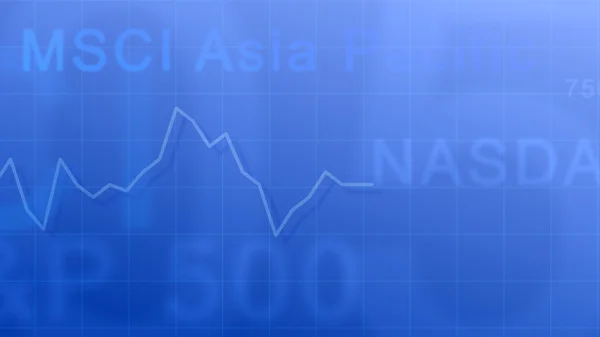
Blurry Growing Digital Graph Interface Over Dark Blue Background. Concept Of Stock Market And Financial
Image, 6.75MB, 8858 × 4724 jpg

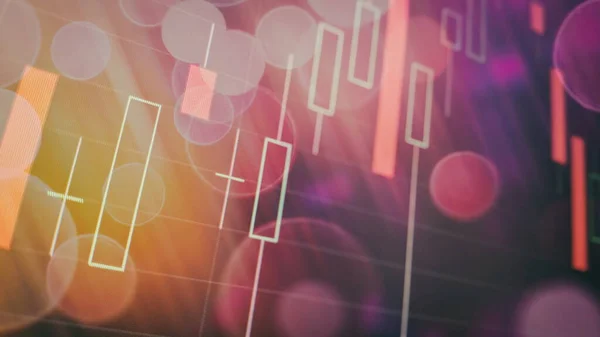
Technical Price Graph And Indicator, Red And Green Candlestick Chart On Blue Theme Screen, Market Volatility, Up And Down Trend. Stock Trading, Crypto Currency Background.
Image, 22.62MB, 8858 × 4724 jpg

Financial Chart With Pen, Stock Analysis Data For Business Background On Digital Screen. Graphs Of The Growth Of The Financial Market Forex. Trading Candlestick Chart
Image, 9.13MB, 8858 × 4724 jpg


Monitor With Stock Data, Closeup. Financial Trading Concept Concept Of Financial Data On A Monitor. Display Of Stock Market Quotes On Dark Background.
Image, 6.57MB, 7680 × 4320 jpg

Economy Trends Background For Business Idea And All Art Work Design. Abstract Finance Background.
Image, 6.01MB, 5315 × 3543 jpg
Technical Price Graph And Indicator, Red And Green Candlestick Chart On Blue Theme Screen, Market Volatility, Up And Down Trend. Stock Trading, Crypto Currency Background.
Image, 11.9MB, 8858 × 4724 jpg

Technical Price Graph And Indicator, Red And Green Candlestick Chart On Blue Theme Screen, Market Volatility, Up And Down Trend. Stock Trading, Crypto Currency Background.
Image, 6.64MB, 13000 × 4000 jpg

Technical Price Graph And Indicator, Red And Green Candlestick Chart On Blue Theme Screen, Market Volatility, Up And Down Trend. Stock Trading, Crypto Currency Background.
Image, 7.79MB, 8268 × 4724 jpg

DAX Is The Most Important Stock Index In Germany, Gold Letters On A Dark Background With Red And Green Bars With A Chart With Japanese Candlesticks, 3D Rendering
Image, 3MB, 4000 × 2600 jpg

Business Success And Growth Concept.Stock Market Business Graph Chart On Digital Screen.Forex Market, Gold Market And Crude Oil Market .
Image, 5.33MB, 5315 × 3543 jpg
Stock Index On The Computer Monitor . Financial Data On A Monitor Which Including Of Market Analyze. Bar Graphs, Diagrams, Financial Figures.
Image, 22.14MB, 8858 × 4724 jpg

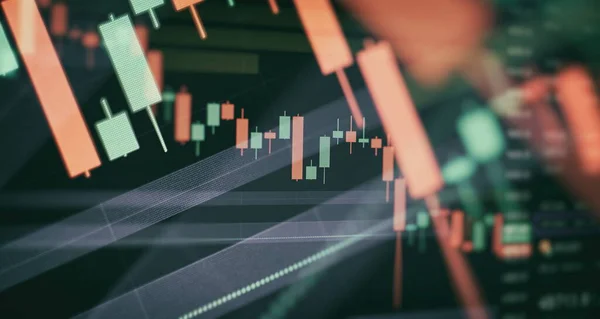
Technical Price Graph And Indicator, Red And Green Candlestick Chart On Blue Theme Screen
Image, 22.84MB, 9803 × 4488 jpg

Monitor With Stock Data, Closeup. Financial Trading Concept Concept Of Financial Data On A Monitor. Display Of Stock Market Quotes On Dark Background.
Image, 8.13MB, 7680 × 4320 jpg

Blurry Growing Digital Graph Interface Over Dark Blue Background. Concept Of Stock Market And Financial
Image, 5.03MB, 8858 × 4724 jpg

Blurry Growing Digital Graph Interface Over Dark Blue Background. Concept Of Stock Market And Financial
Image, 9.68MB, 8858 × 4724 jpg

Economy Trends Background For Business Idea And All Art Work Design. Abstract Finance Background.
Image, 5.95MB, 5472 × 3648 jpg

National Flag Of Germany With A Large Display Of Daily Stock Market Price And Quotations.
Image, 5.97MB, 6016 × 4016 jpg
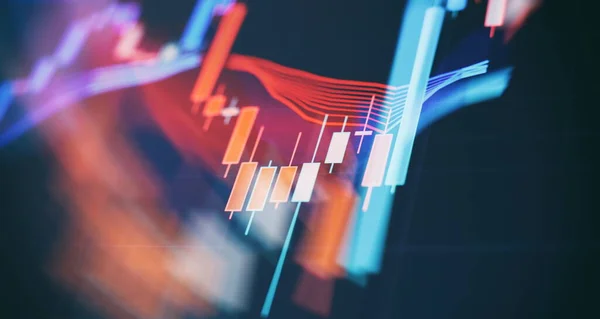
Price Graph And Indicator, Red And Green Candlestick Chart On Blue Theme Screen, Market Volatility, Up And Down Trend.
Image, 12.83MB, 9803 × 4488 jpg

Technical Price Graph And Indicator, Red And Green Candlestick Chart On Blue Theme Screen, Market Volatility, Up And Down Trend. Stock Trading, Crypto Currency Background.
Image, 5.1MB, 5315 × 3543 jpg

Monitor With Stock Data, Closeup. Financial Trading Concept Concept Of Financial Data On A Monitor. Display Of Stock Market Quotes On Dark Background.
Image, 10.11MB, 7680 × 4320 jpg

Financial Chart With Pen, Stock Analysis Data For Business Background On Digital Screen. Graphs Of The Growth Of The Financial Market Forex. Trading Candlestick Chart
Image, 11.1MB, 8858 × 4724 jpg

Technical Price Graph And Indicator, Red And Green Candlestick Chart On Blue Theme Screen, Market Volatility, Up And Down Trend. Stock Trading, Crypto Currency Background.
Image, 5.37MB, 13000 × 4000 jpg


Technical Price Graph And Indicator, Red And Green Candlestick Chart On Blue Theme Screen, Market Volatility, Up And Down Trend. Stock Trading, Crypto Currency Background.
Image, 11.03MB, 8268 × 4724 jpg

Monitor With Stock Data, Closeup. Financial Trading Concept Concept Of Financial Data On A Monitor. Display Of Stock Market Quotes On Dark Background.
Image, 8.4MB, 7680 × 4320 jpg

Financial Chart With Pen, Stock Analysis Data For Business Background On Digital Screen. Graphs Of The Growth Of The Financial Market Forex. Trading Candlestick Chart
Image, 4.61MB, 5472 × 3648 jpg
Technical Price Graph And Indicator, Red And Green Candlestick Chart On Blue Theme Screen, Market Volatility, Up And Down Trend. Stock Trading, Crypto Currency Background.
Image, 4.41MB, 7680 × 4320 jpg


Business Success And Growth Concept.Stock Market Business Graph Chart On Digital Screen.Forex Market, Gold Market And Crude Oil Market .
Image, 6.29MB, 5472 × 3648 jpg

Technical Price Graph And Indicator, Red And Green Candlestick Chart On Blue Theme Screen, Market Volatility, Up And Down Trend. Stock Trading, Crypto Currency Background.
Image, 17.18MB, 8858 × 4724 jpg

Technical Price Graph And Indicator, Red And Green Candlestick Chart On Blue Theme Screen, Market Volatility, Up And Down Trend. Stock Trading, Crypto Currency Background.
Image, 9.13MB, 13000 × 4000 jpg
Abstract Background Of Trading Stock Market EMA Indicator Technical Analysis Graph With Stock Market Volume Chart
Vector, 9.37MB, 6000 × 3375 eps

Technical Price Graph And Indicator, Red And Green Candlestick Chart On Blue Theme Screen, Market Volatility, Up And Down Trend. Stock Trading, Crypto Currency Background.
Image, 2.97MB, 5315 × 3543 jpg

Blurry Growing Digital Graph Interface Over Dark Blue Background. Concept Of Stock Market And Financial
Image, 3.18MB, 5472 × 3648 jpg

Blurry Growing Digital Graph Interface Over Dark Blue Background. Concept Of Stock Market And Financial
Image, 11.35MB, 8858 × 4724 jpg


Forex Trading Graph And Candlestick Chart Suitable For Financial Investment Concept. Economy Trends Background For Business Idea And All Art Work Design. Abstract Finance Background.
Image, 9.36MB, 8858 × 4724 jpg

Stock Index On The Computer Monitor . Financial Data On A Monitor Which Including Of Market Analyze. Bar Graphs, Diagrams, Financial Figures.
Image, 10.79MB, 8858 × 4724 jpg

Blurry Growing Digital Graph Interface Over Dark Blue Background. Concept Of Stock Market And Financial
Image, 6.92MB, 8858 × 4724 jpg

Price Graph And Indicator, Red And Green Candlestick Chart On Blue Theme Screen, Market Volatility, Up And Down Trend.
Image, 8.35MB, 9803 × 4488 jpg


Technical Price Graph And Indicator, Red And Green Candlestick Chart On Blue Theme Screen, Market Volatility, Up And Down Trend. Stock Trading, Crypto Currency Background.
Image, 12.18MB, 8268 × 4724 jpg
Previous << Page 2 >> Next