
Stock image Indices page 2


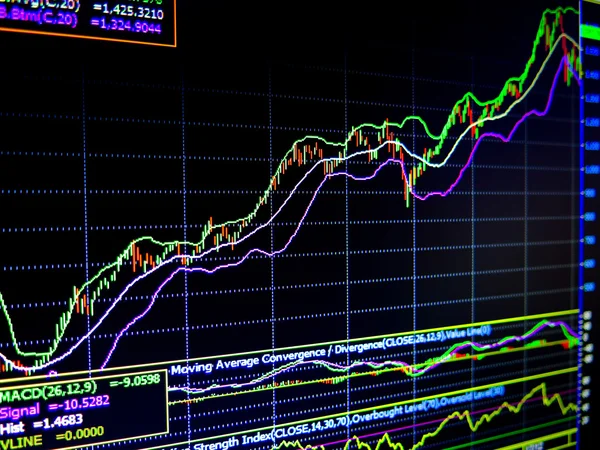
Animated Line Chart Representing Demographic Statistics Data, Analytical Graph
Image, 0.6MB, 3840 × 2160 jpg


BATH, UK - JUNE 11, 2018 : An Apple IPhone 6 On A Desk Displaying Stock Market Information Using The Apple Stock App. A Human Hand Hovers Above The FTSE 100 Index Figure.
Image, 13.95MB, 5752 × 3828 jpg

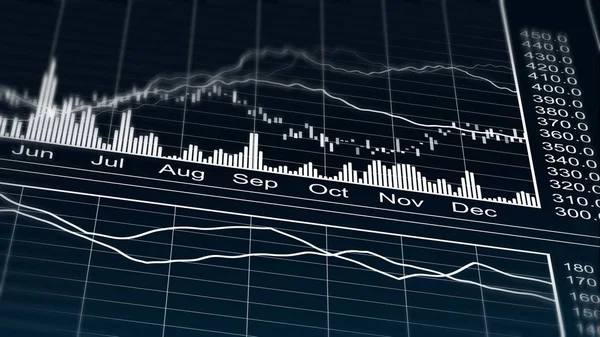
Computer Generated Line Graph On Company Marketing Strategy Results Per Year
Image, 0.85MB, 3840 × 2160 jpg


Technology Backdrop Abstract Connection Dots, Futuristic Infographics Data Graphic, Monitor Screen In Perspective
Image, 7.47MB, 10455 × 5881 jpg


3d Render Closeup Of Computer Keyboard With CAC 40 Index Button. Stock Market Indexes Concept.
Image, 6.11MB, 5000 × 3750 jpg

3d Render Closeup Of Computer Keyboard With S&P 500 Index Button. Stock Market Indexes Concept.
Image, 8.41MB, 5000 × 3750 jpg
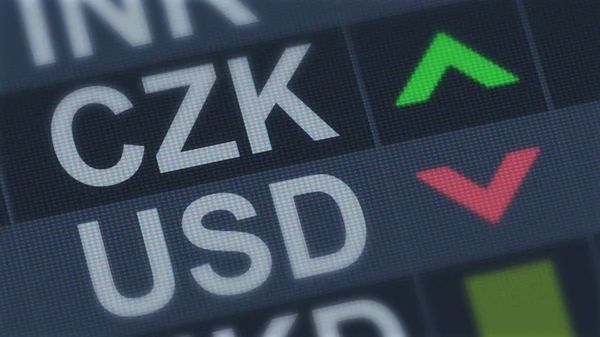
Czech Koruna Rising, American Dollar Falling, Exchange Rate Fluctuation, Finance
Image, 4.33MB, 3840 × 2160 jpg


Derivatives Vector Infographic Icon Set. Trendy Modern Flat Linear Vector Derivatives Icon On White Background From Thin Line, Derivatives Collection, Outline Vector Illustration
Vector, 0.31MB, 4167 × 4167 eps

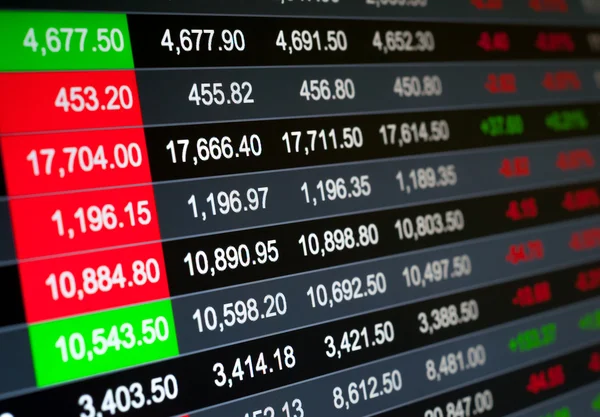
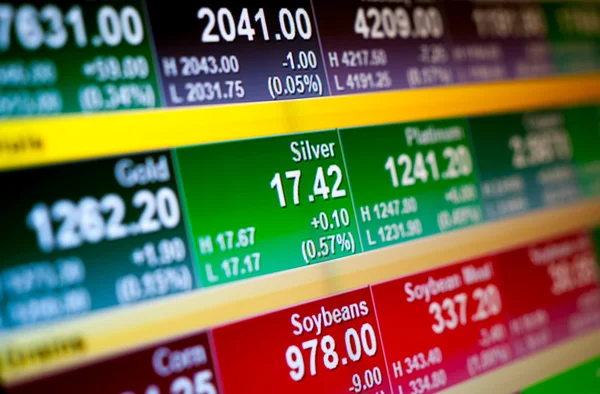
Stock Market Tickers Index Share Prices Financial News 3d Illustration
Image, 19.83MB, 5000 × 4000 jpg


3d Render Closeup Of Computer Keyboard With EURO STOXX 50 Index Button. Stock Market Indexes Concept.
Image, 5.35MB, 5000 × 3750 jpg
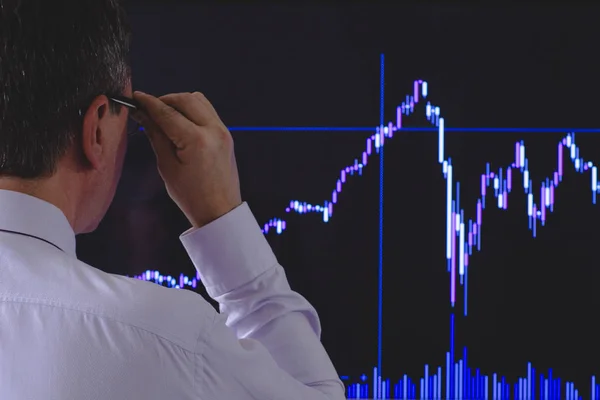
The Investor Is Looking At A Volatile Chart Of Stock Indexes. A Black Day On The Stock Exchange And Falling Quotes.
Image, 2.97MB, 2770 × 1846 jpg

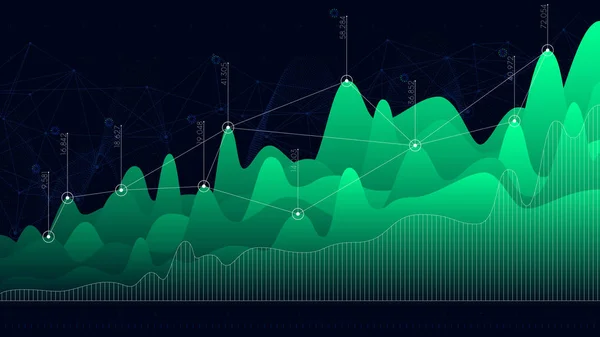
Stock Market Or Forex Trading Graph. Chart In Financial Market Vector Illustration Abstract Finance Background
Vector, 0.38MB, 5905 × 3937 eps

Stock Market Or Forex Trading Graph. Chart In Financial Market Vector Illustration Abstract Finance Background
Vector, 11.13MB, 5905 × 3937 eps


Stock Market Candlestick Chart Vector Illustration. Buy And Sell Indicators For Trade On The Chart. Financial Diagram With Assets Values Moving Up And Down.
Vector, 9.17MB, 5500 × 2914 eps
Stock Market Or Forex Trading Graph. Chart In Financial Market Vector Illustration Abstract Finance Background.
Vector, 5.6MB, 5906 × 3937 eps
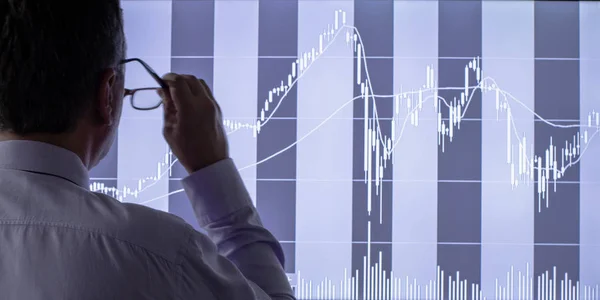
The Investor Analyzes The Stock Index Quotes Chart. A Black Day On The Stock Exchange And Falling Quotes.
Image, 3.32MB, 3652 × 1826 jpg

Russell 2000 Global Stock Market Index. With A Dark Background And A World Map. Graphic Concept For Your Design.
Image, 8.64MB, 5525 × 3684 jpg
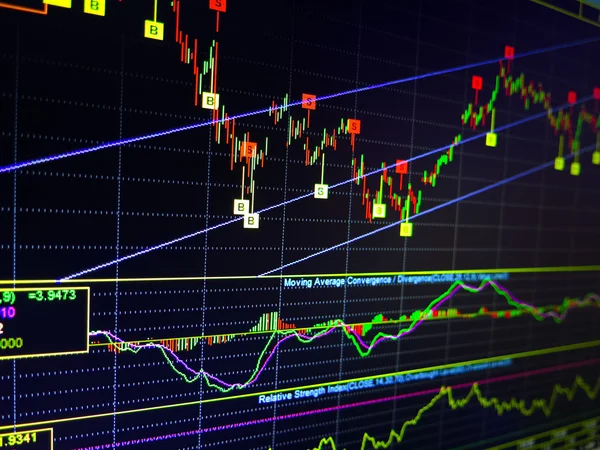
Forex Trade Market Chart Illustration. Stock Market Graph Diagram With Candlestick Bars And Indices Signals Graphic Design.
Image, 6.26MB, 6667 × 3750 jpg

Markings On The Sidewall Of A New Winter Tire, Markings For Speed, Load, Rotation Direction, Mud, Snow, Snowflake Symbol And Winter Tire Mark
Image, 6.85MB, 5212 × 3475 jpg
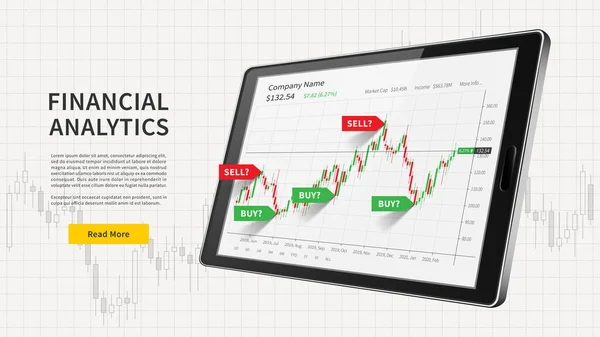
Tablet With Stock Trade Candlestick Graph And Signals Web Banner. Financial Analytics Vector Illustration. Stock Exchange Market Chart With Buy And Sell Signals Graphic Design Concept.
Vector, 5.66MB, 9258 × 5208 eps
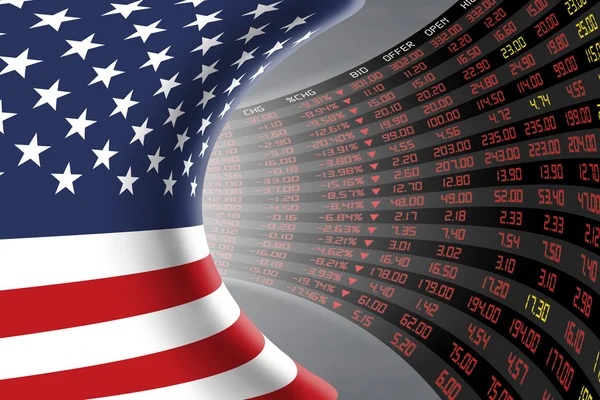
Flag Of The United States Of America With A Large Display Of Daily Stock Market Price And Quotations.
Image, 6.82MB, 6016 × 4016 jpg
Previous << Page 2 >> Next