
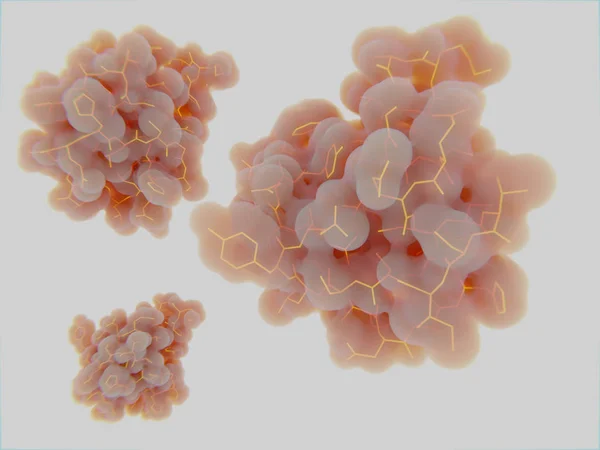
Stock image Kinase
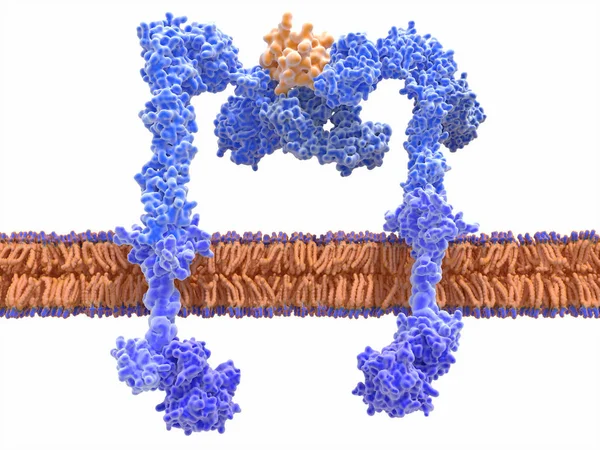
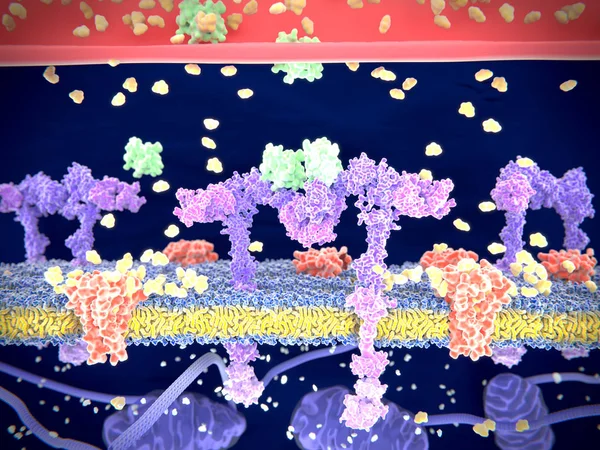
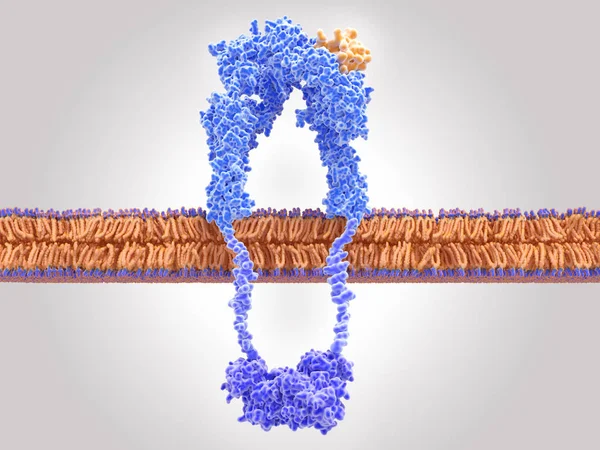
The Insulin Receptor (blue) Is A Transmembrane Protein, That Is Activated By Insulin (orange). Insulin Binding Induces Structural Changes Within The Receptor That Finally Leads To The Activation Of The Glucose Transporter Protein.
Image, 12.2MB, 8000 × 6000 jpg
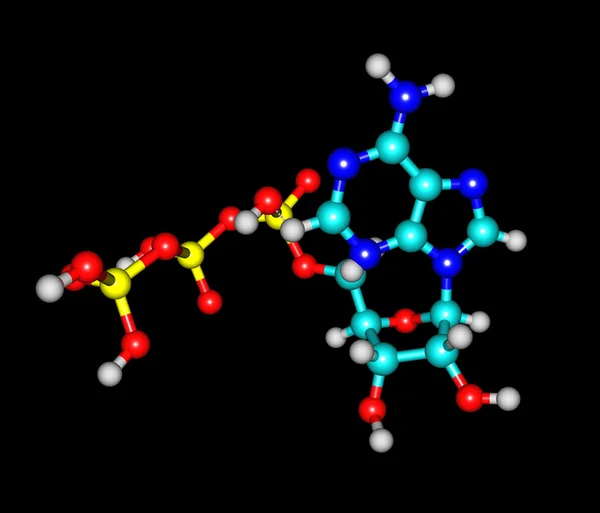
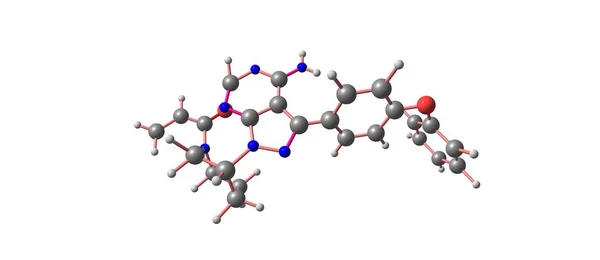
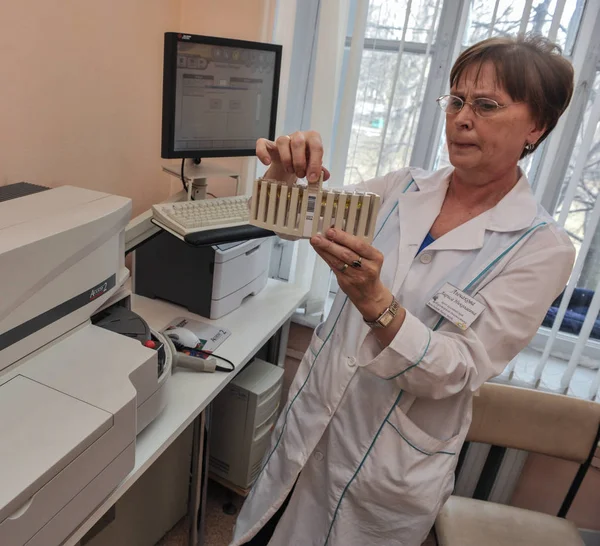
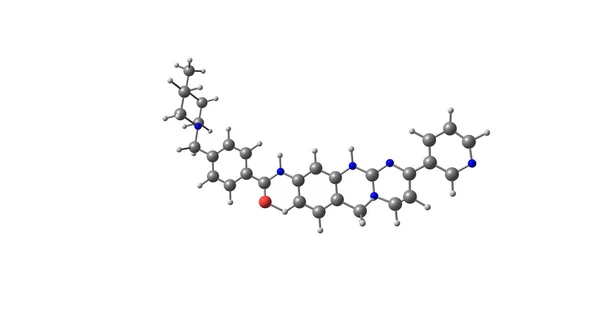
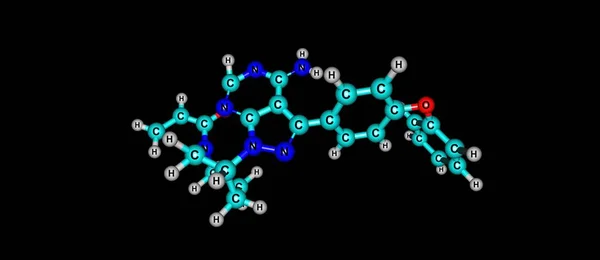
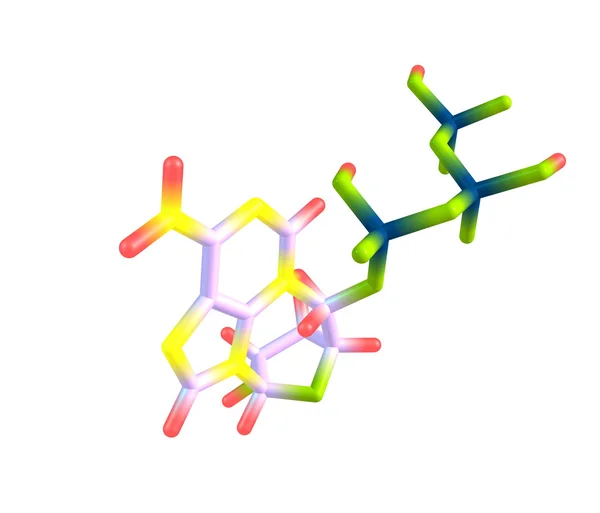
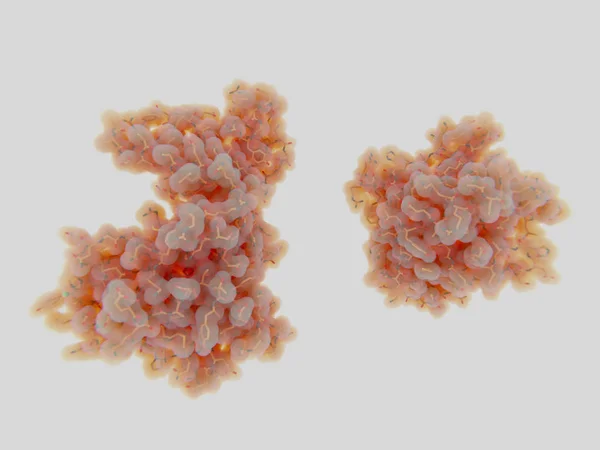

Diagram Showing Enzymatic Transformation Of Steroid Hormones - Oestradiol To Oestrone And Oestrone Sulpfate. Biochemical Metabolic Endogenous Reaction.
Vector, 5.65MB, 2000 × 2000 eps

Diagram Showing Enzymatic Transformation Of Steroid Hormones - Oestradiol To Oestrone And Oestrone Sulpfate. Biochemical Metabolic Endogenous Reaction.
Vector, 5.66MB, 2000 × 2000 eps

Diagram Showing Enzymatic Transformation Of Steroid Hormones - Oestradiol To Oestrone And Oestrone Sulpfate. Biochemical Metabolic Endogenous Reaction.
Vector, 5.65MB, 2000 × 2000 eps
CPK _ Creatine Phosphokinase, Letters And Icons, And Vector Illustration.
Vector, 1.24MB, 3402 × 3402 eps
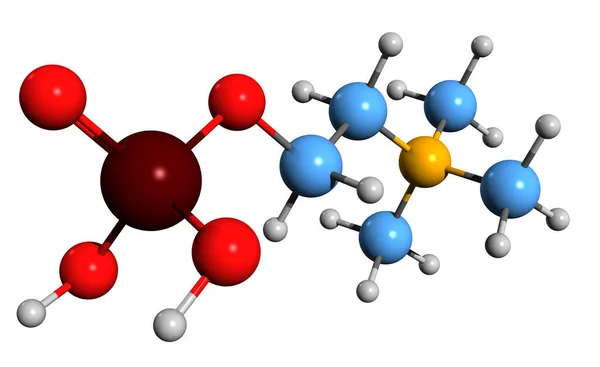
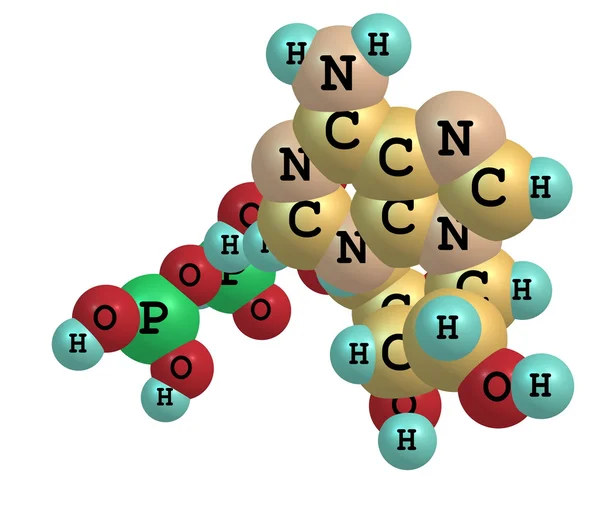
3D Image Of Phosphocholine Skeletal Formula - Molecular Chemical Structure Of Phosphatidylcholine Intermediate Isolated On White Background
Image, 4.39MB, 8070 × 4944 jpg

Diagram Showing Enzymatic Transformation Of Steroid Hormones - Oestradiol To Oestrone And Oestrone Sulpfate. Biochemical Metabolic Endogenous Reaction.
Vector, 5.65MB, 2000 × 2000 eps


Cyclic Adenosine Monophosphat (cAMP, Red) Is A Second Messenger Used For Signal Transduction Through The Activation Of Various Protein Kinases (blue). The One In The Foreground Is Protein Kinase A. Source: PDB Entry 3tnp.
Image, 7MB, 8000 × 6000 jpg

Cyclic Guanosine Monophosphate (cGMP) Molecule. Sheet Of Paper In A Cage. Structural Chemical Formula And Molecule Model. Vector Illustratio
Vector, 0.86MB, 5000 × 3571 eps

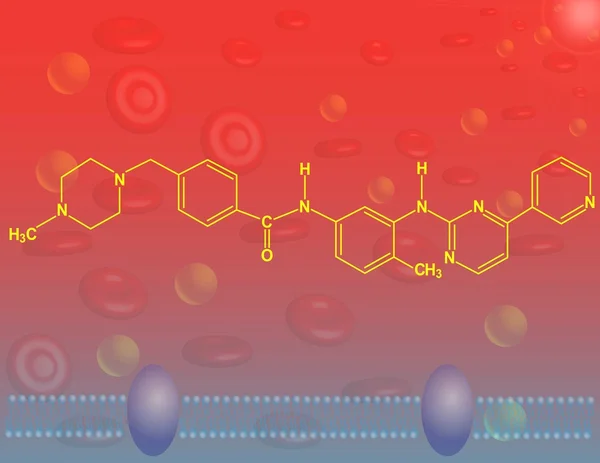
Chemical Formula, Skeletal Formula And 3D Ball-and-stick Model Of A Chemotherapeutic Drug Lenvatinib, White Background
Image, 1.55MB, 6000 × 4000 jpg

Diagram Showing Enzymatic Transformation Of Steroid Hormones - Oestradiol To Oestrone And Oestrone Sulpfate. Biochemical Metabolic Endogenous Reaction.
Vector, 5.66MB, 2000 × 2000 eps

CAMP Cyclic Adenosine MonoPhosphate - Second Messenger Important In Many Biological Processes, Acronym Text On Blackboard
Image, 11.5MB, 5760 × 3840 jpg

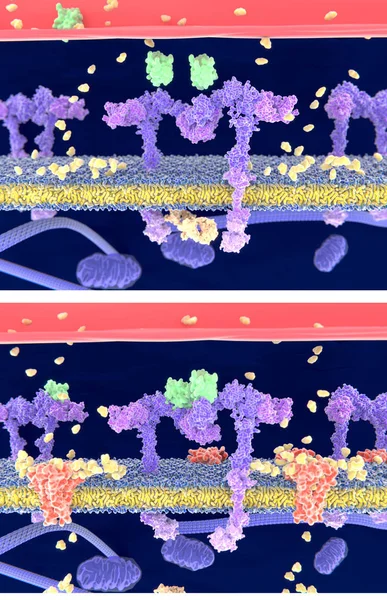
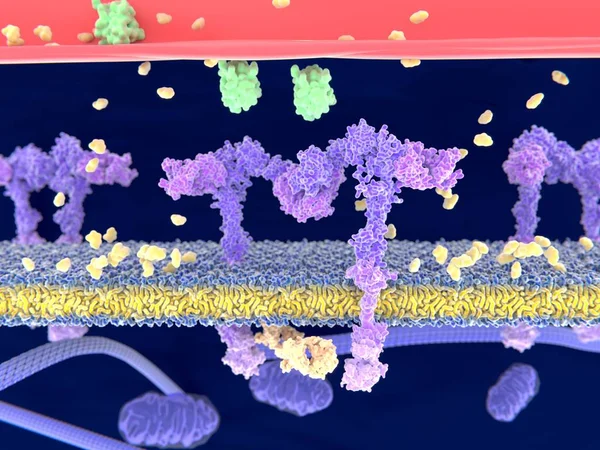
Insulin (green) Binding To The Insulin Receptor (violet) Activates The Transport Of Glucose (yellow) Into The Cell (depicted In 2 Phases) - Illustration
Image, 4.57MB, 4000 × 6200 jpg

Structure Of Cyclin-dependent Kinase CDK9 (green) In Complex With Cyclin T (brown) And A 2-amino-4-heteroaryl- Pyrimidine Inhibitor. 3D Cartoon And Gaussian Surface Models, PDB 4bci, White Background
Image, 4.27MB, 8000 × 4000 jpg
Insulin (green) Binding To The Insulin Receptor (violet) Activates The Transport Of Glucose (yellow) Into The Cell. Illustration
Image, 6.21MB, 8000 × 6000 jpg
The Mitotic Kinase NEK7 Binds To Inactive NRLP3 Leading To The Activation Of The Inflammasome
Image, 3.59MB, 8000 × 6000 jpg
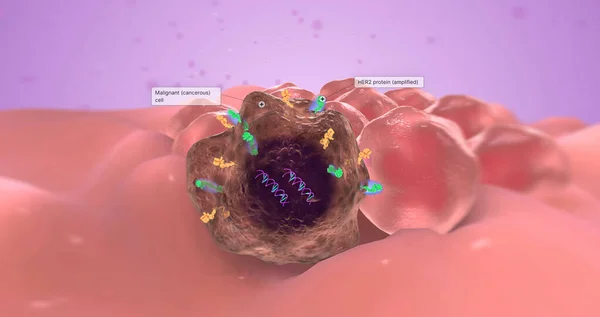
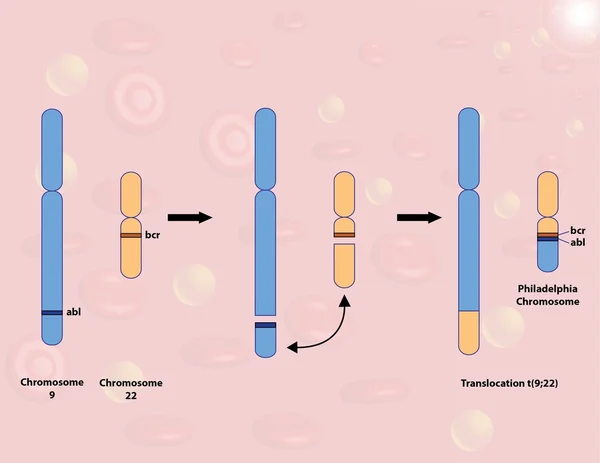
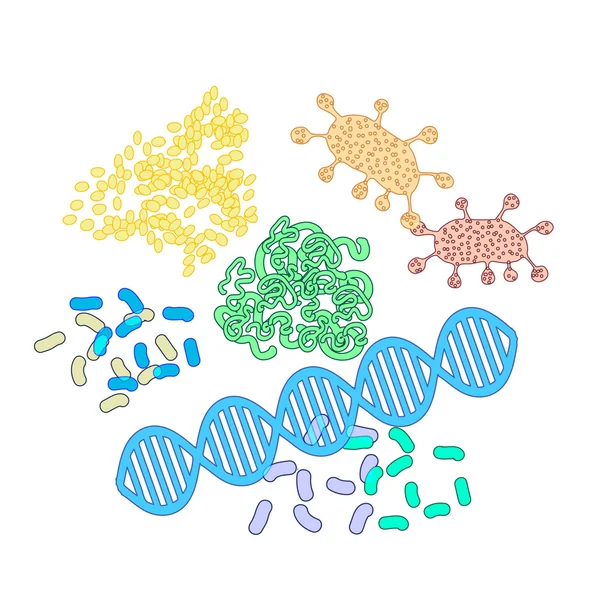
The Abnormal Gene Is Known As An Oncogene Because It Causes Tumor Growth. 3D Rendering
Image, 2.86MB, 7340 × 3884 jpg
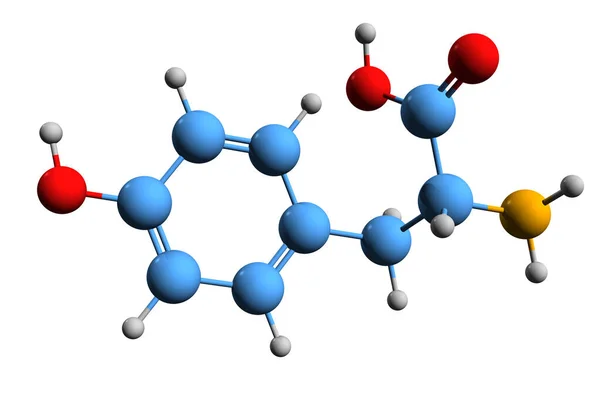
3D Image Of Tyrosine Skeletal Formula - Molecular Chemical Structure Of 4-hydroxyphenylalanine Isolated On White Background
Image, 2.01MB, 5500 × 3630 jpg
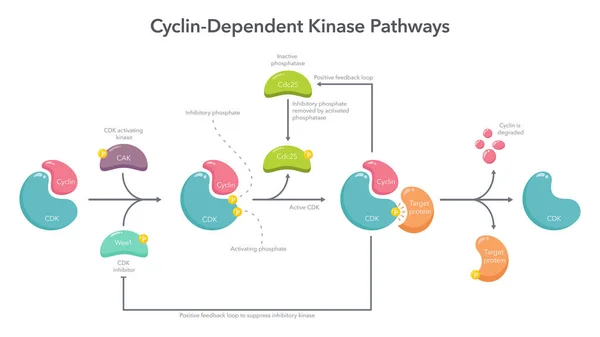
Cyclin Dependent Kinase Activation Pathway Science Vector Illustration Infographic
Vector, 0.45MB, 8333 × 4688 ai
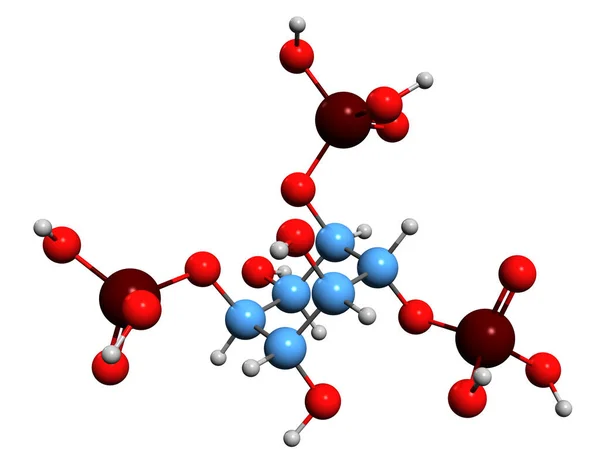
3D Image Of Inositol Trisphosphate Skeletal Formula - Molecular Chemical Structure Of Inositol Phosphate Signaling Molecule Isolated On White Background
Image, 3.87MB, 6943 × 5520 jpg

Hand Writing Creatine With Blue Marker On Transparent Wipe Board Isolated On White Background.
Image, 2.69MB, 5616 × 3744 jpg
Insulin (green) Binding To The Insulin Receptor (violet) Activates The Transport Of Glucose (yellow) Into The Cell. Illustration
Image, 3.71MB, 8000 × 6000 jpg

Structure Of Cyclin-dependent Kinase 2 (CDK2, Blue) In Complex With Cyclin E (brown). 3D Cartoon And Gaussian Surface Models, PDB 1w98, White Background
Image, 3.84MB, 8000 × 4000 jpg

Insulin (green) Binding To The Insulin Receptor (violet) Activates The Transport Of Glucose (yellow) Into The Cell (phase 1). Illustration
Image, 3.96MB, 8000 × 6000 jpg
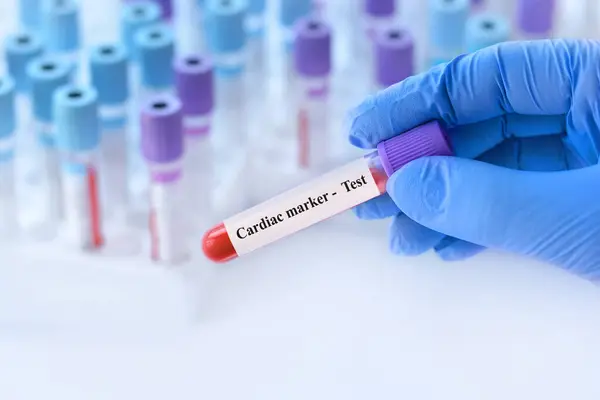
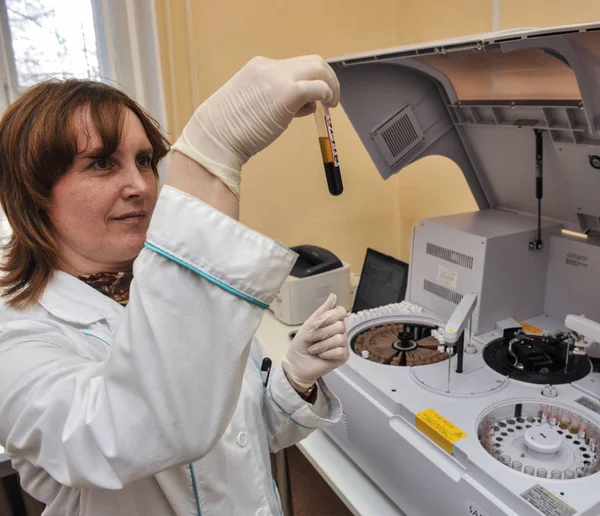
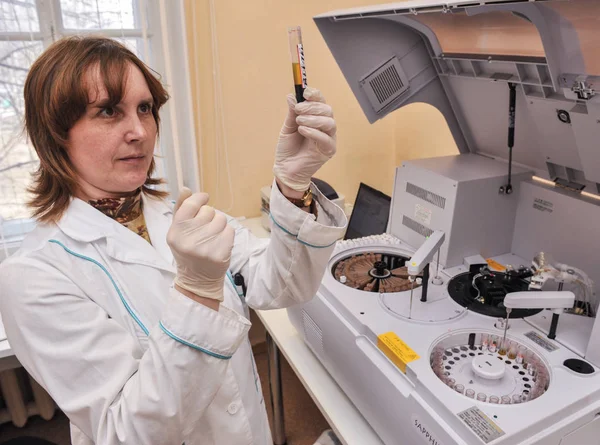
Doctor Holding A Test Blood Sample Tube With Cardiac Marker Test On The Background Of Medical Test Tubes With Analyzes.
Image, 9.05MB, 6000 × 4000 jpg

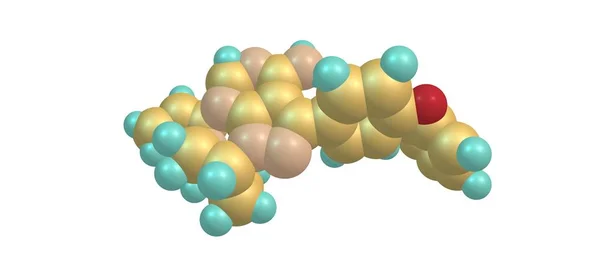
Alectinib Molecule Is An Oral Drug That Blocks The Activity Of Anaplastic Lymphoma Kinase And Is Used To Treat Non-small-cell Lung Cancer. 3d Illustration
Image, 0.73MB, 7000 × 3638 jpg
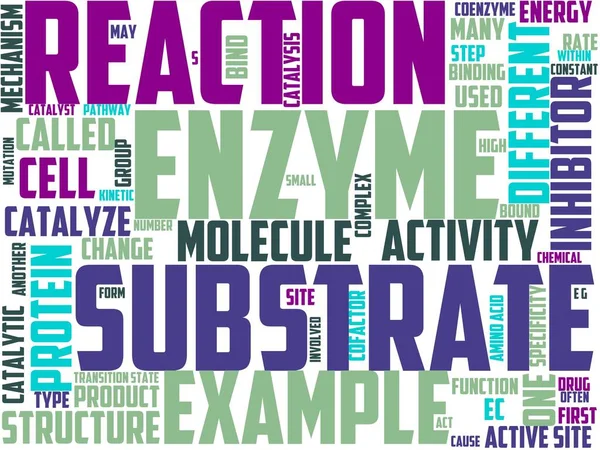
Enzymology Typography, Wordart, Wordcloud, Enzyme, Enzymology, Science, Chemical
Image, 0.92MB, 6400 × 4800 jpg
Page 1 >> Next