
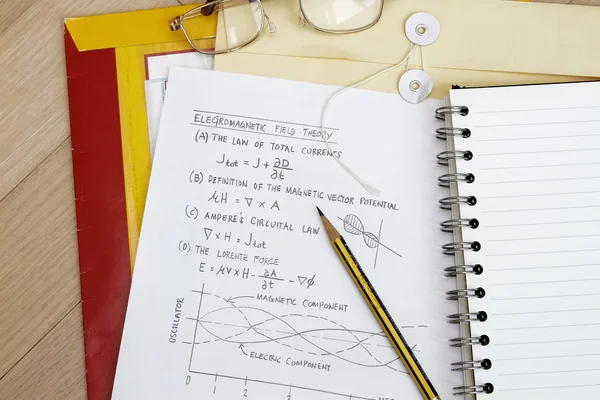
Stock image Oscillator page 2


Ascending Wedge Pattern Figure Technical Analysis. Vector Stock And Cryptocurrency Exchange Graph, Forex Analytics And Trading Market Chart. Rising Bearish Wedge Breakouts Flat Vector Icon.
Vector, 5.49MB, 5000 × 3216 eps

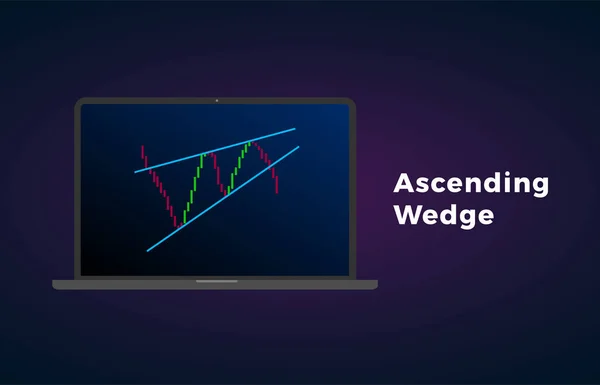
Descending Wedge Pattern Figure Technical Laptop Analysis. Vector Stock And Cryptocurrency Exchange Graph, Forex Analytics And Trading Market Chart. Falling Bullish Wedge Breakouts Flat Vector Icon.
Vector, 0.5MB, 5000 × 3216 eps

Analysis For Professional Technical Analysis On The Monitor Of A Computer.
Image, 7.21MB, 5472 × 3648 jpg

Financial Instruments With Various Type Of Indicators Including Volume Analysis For Professional Technical Analysis
Image, 11.28MB, 8858 × 4724 jpg


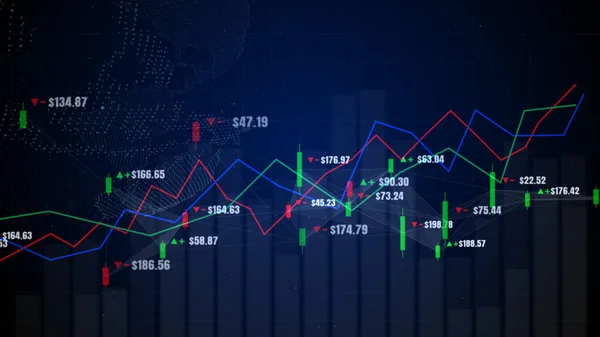
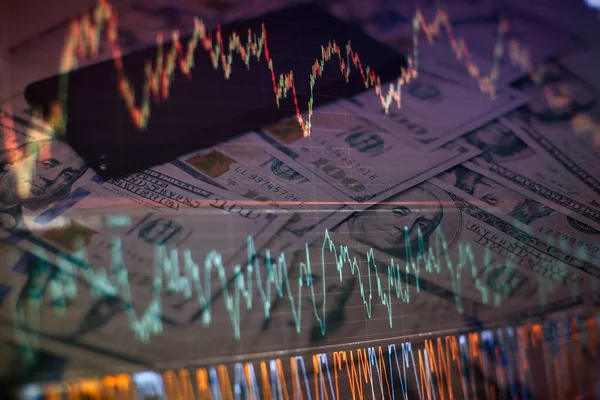
Economy Trends Background For Business Idea And All Art Work Design. Abstract Finance Background. Business Success And Growth Concept.
Image, 10.98MB, 7677 × 4065 jpg


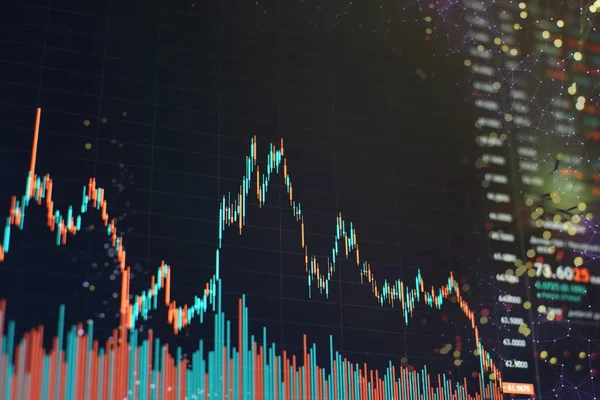
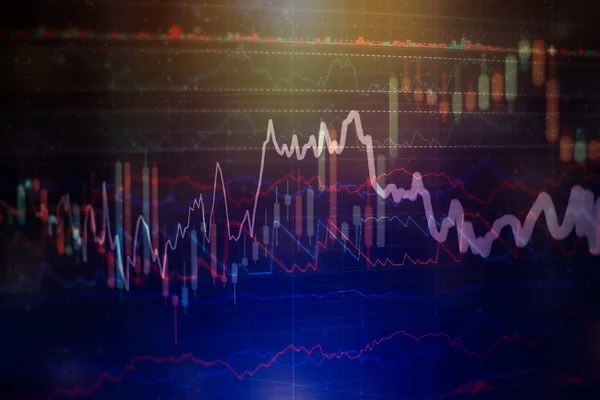
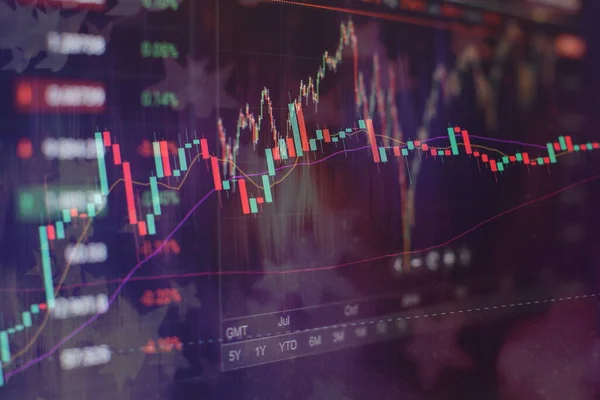
Technical Price Graph And Indicator, Red And Green Candlestick Chart On Blue Theme Screen, Market Volatility, Up And Down Trend. Stock Trading, Crypto Currency Background.
Image, 2.13MB, 5315 × 3543 jpg

Bollinger Bands Technical Analysis Indicator Cloud On Stock Market, Forex And Cryptocurrency Trading Exchange Market. Laptop Display Screen With Graph And Candle Stick
Vector, 3.34MB, 5000 × 3214 eps

Conceptual Hand Writing Showing Options Trading. Business Photo Showcasing Seller Gives Buyer Right But Not Obligation Buy Sell Shares Businessman Sitting On Chair Working On Computer And Books.
Image, 7.15MB, 6984 × 6984 jpg

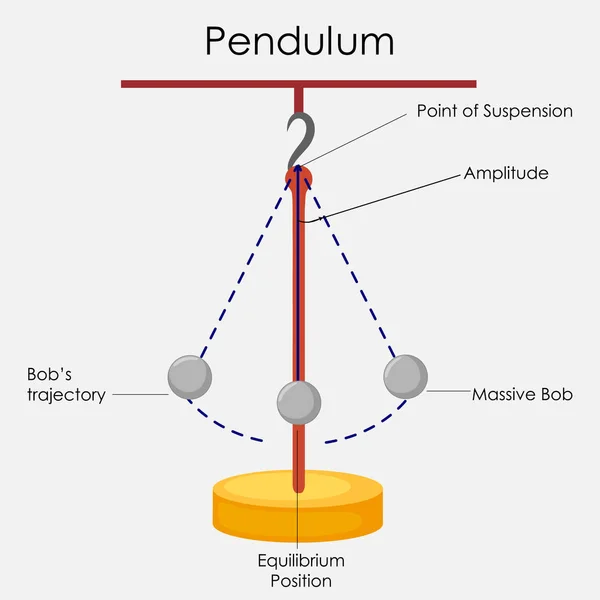
Handwriting Text Writing Momentum. Concept Meaning Quantity Motion In Moving Body Product Of Mass And Velocity Sticky Cards Board Pinned Muliple Colours Remember Idea Jute Background
Image, 6.5MB, 5616 × 3744 jpg
Charts Of Financial Instruments With Various Type Of Indicators Including Volume Analysis For Professional Technical Analysis On The Monitor Of A Computer.
Image, 5.84MB, 5315 × 3543 jpg
Charts Of Financial Instruments With Various Type Of Indicators Including Volume Analysis For Professional Technical Analysis On The Monitor Of A Computer.
Image, 5.94MB, 5315 × 3543 jpg


Analysis Business Accounting On Info Sheets. Businessman Hand Working On Analyzing Investment Charts For Gold Market, Forex Market And Trading Market.
Image, 6.04MB, 5315 × 3543 jpg
Technical Price Graph And Indicator, Red And Green Candlestick Chart On Blue Theme Screen, Market Volatility, Up And Down Trend. Stock Trading, Crypto Currency Background.
Image, 7.87MB, 5315 × 3543 jpg

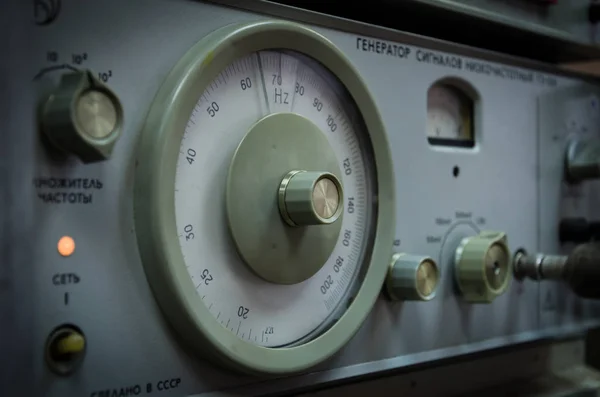
Sine Wave Monitor, Oscillator, Interface, Display With Green Radar. Experiment, Sine Curve, Mathematic, Physics, Digital Display, Interface, HUD, Diagram, Control.
Image, 5.43MB, 6000 × 3375 jpg


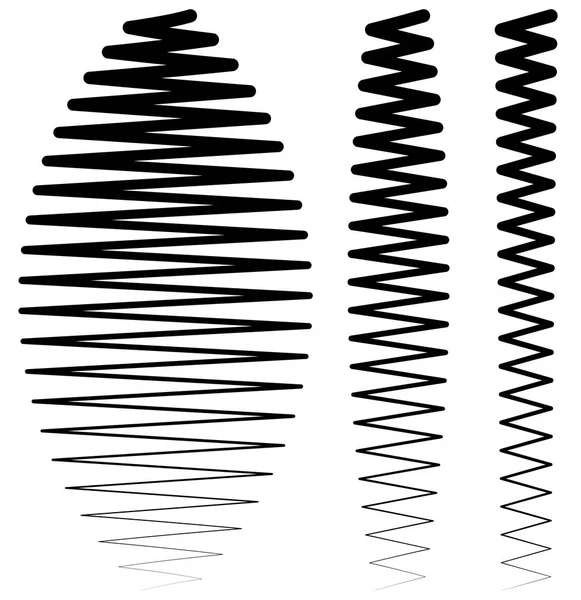
Vector Seamless Reaction Diffusion Set - Mathematical Biology Turing Patterns
Vector, 0.88MB, 9958 × 3034 eps
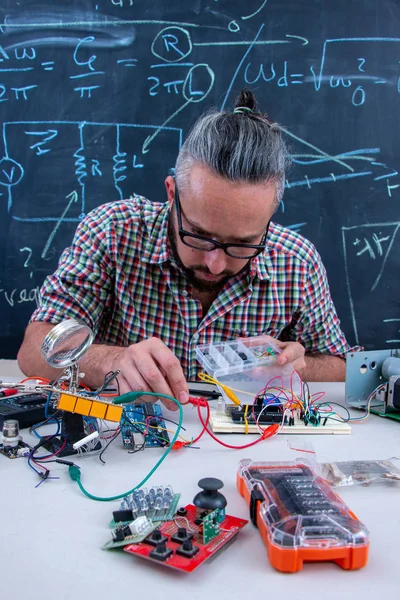
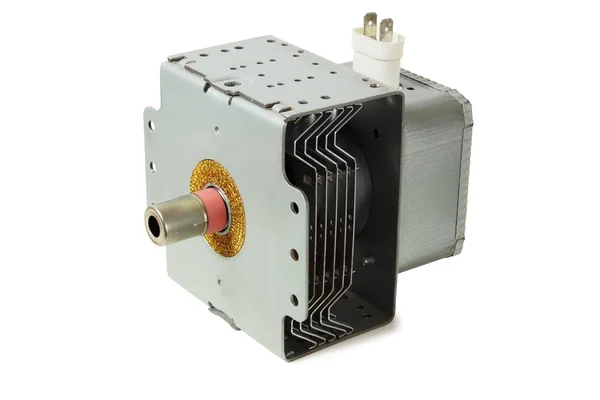
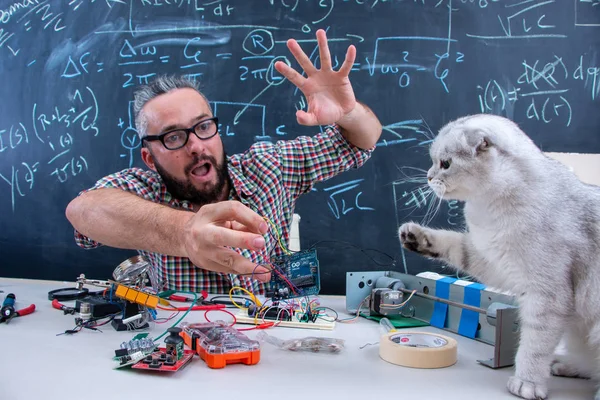
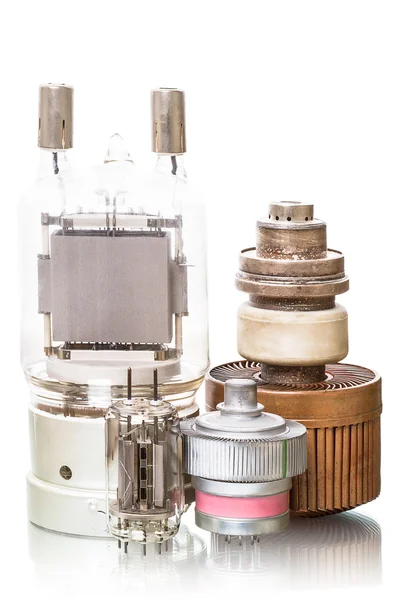
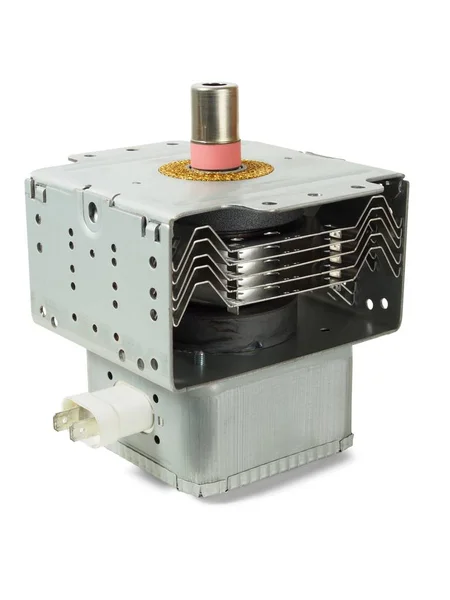
Close-up Of Detail Of Laboratory Electronic Oscillator Apparatus And Measuring Instrument
Image, 6.7MB, 4928 × 3264 jpg

Ascending Wedge Pattern Figure Technical Analysis. Vector Stock And Cryptocurrency Exchange Graph, Forex Analytics And Trading Market Chart. Rising Bearish Wedge Breakouts Flat Icon.
Vector, 0.43MB, 5000 × 3216 eps
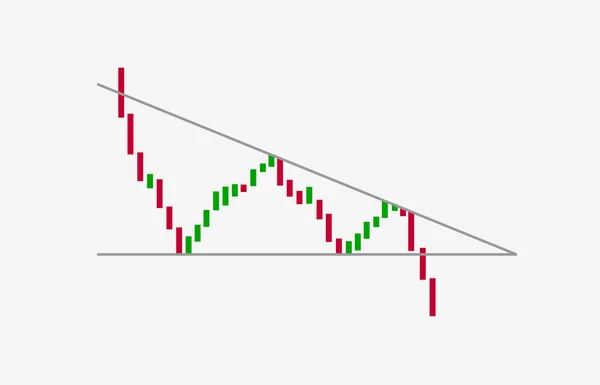
Descending Triangle Bearish Breakouts Flat Icon. Vector Stock And Cryptocurrency Exchange Graph, Forex Analytics And Trading Market Chart. Descending Triangle Pattern Figure Technical Analysis.
Vector, 0.43MB, 5000 × 3216 eps

The Business Plan At The Meeting And Analyze Financial Numbers To View The Performance Of The Company.
Image, 6.19MB, 5315 × 3543 jpg

Technical Price Graph And Indicator, Red And Green Candlestick Chart On Blue Theme Screen, Market Volatility, Up And Down Trend. Stock Trading, Crypto Currency Background.
Image, 4.09MB, 5472 × 3648 jpg

Indicators Including Volume Analysis For Professional Technical Analysis On The Monitor Of A Computer. Fundamental And Technical Analysis Concept.
Image, 2.75MB, 5315 × 3543 jpg

Technical Price Graph And Indicator, Red And Green Candlestick Chart On Blue Theme Screen, Market Volatility, Up And Down Trend. Stock Trading, Crypto Currency Background.
Image, 6.1MB, 5315 × 3543 jpg
Previous << Page 2 >> Next