
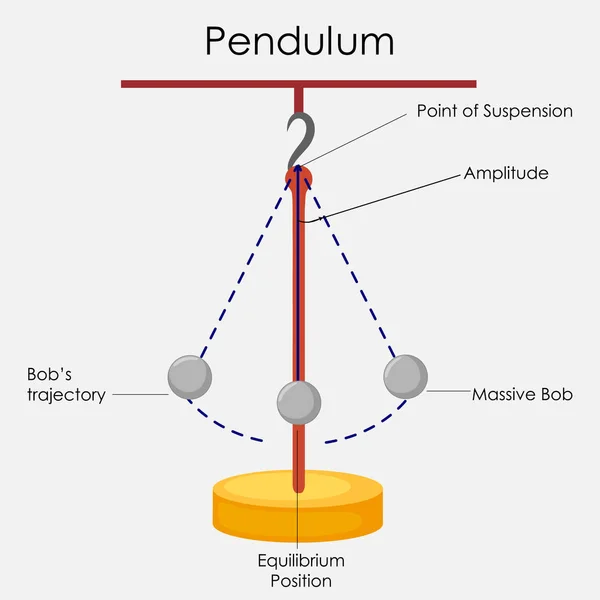
Stock image Oscillator page 3

Charts Of Financial Instruments With Various Type Of Indicators Including Volume Analysis For Professional Technical Analysis On The Monitor Of A Computer.
Image, 5.84MB, 5315 × 3543 jpg
Charts Of Financial Instruments With Various Type Of Indicators Including Volume Analysis For Professional Technical Analysis On The Monitor Of A Computer.
Image, 5.94MB, 5315 × 3543 jpg


Analysis Business Accounting On Info Sheets. Businessman Hand Working On Analyzing Investment Charts For Gold Market, Forex Market And Trading Market.
Image, 6.04MB, 5315 × 3543 jpg
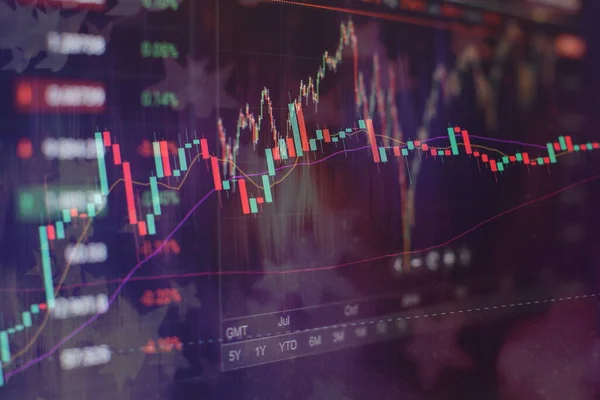
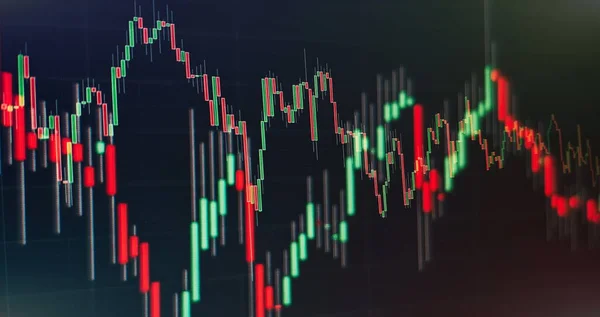
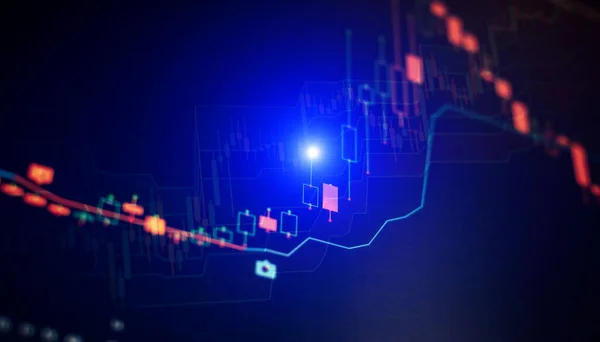
Technical Price Graph And Indicator, Red And Green Candlestick Chart On Blue Theme Screen, Market Volatility, Up And Down Trend. Stock Trading, Crypto Currency Background.
Image, 7.87MB, 5315 × 3543 jpg

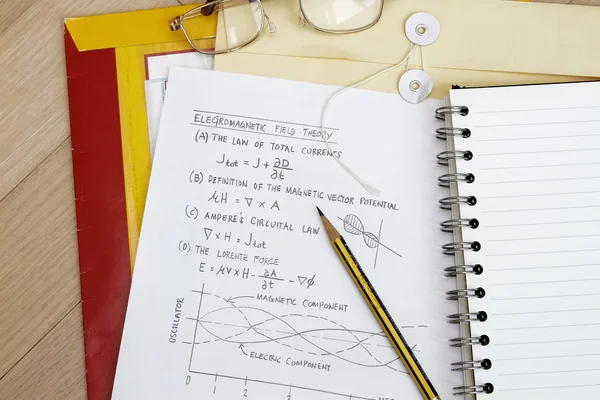
Sine Wave Monitor, Oscillator, Interface, Display With Green Radar. Experiment, Sine Curve, Mathematic, Physics, Digital Display, Interface, HUD, Diagram, Control.
Image, 5.43MB, 6000 × 3375 jpg

Vector Seamless Reaction Diffusion Set - Mathematical Biology Turing Patterns
Vector, 0.88MB, 9958 × 3034 eps
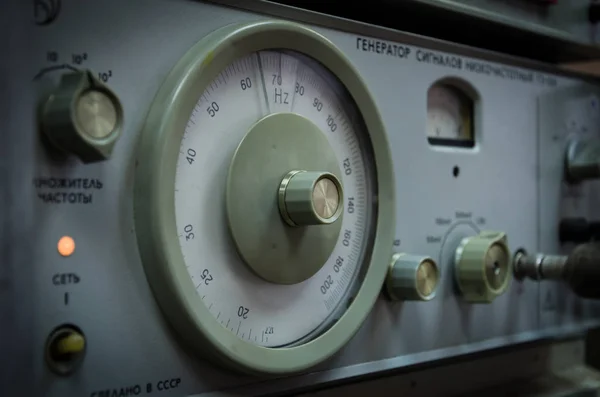
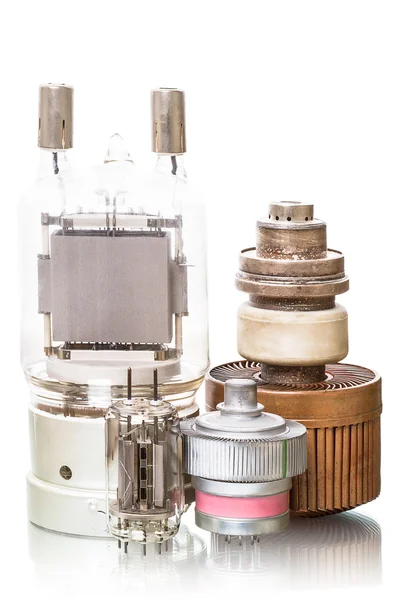
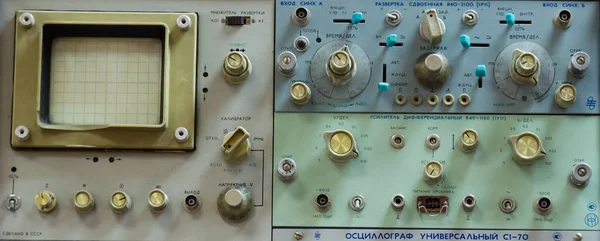
Close-up Of Detail Of Laboratory Electronic Oscillator Apparatus And Measuring Instrument
Image, 6.7MB, 4928 × 3264 jpg

Ascending Wedge Pattern Figure Technical Analysis. Vector Stock And Cryptocurrency Exchange Graph, Forex Analytics And Trading Market Chart. Rising Bearish Wedge Breakouts Flat Icon.
Vector, 0.43MB, 5000 × 3216 eps
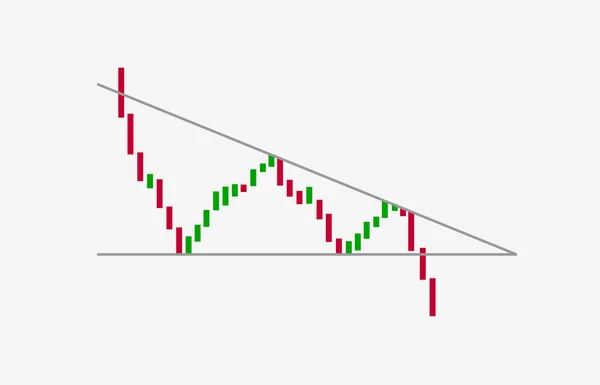
Descending Triangle Bearish Breakouts Flat Icon. Vector Stock And Cryptocurrency Exchange Graph, Forex Analytics And Trading Market Chart. Descending Triangle Pattern Figure Technical Analysis.
Vector, 0.43MB, 5000 × 3216 eps

The Business Plan At The Meeting And Analyze Financial Numbers To View The Performance Of The Company.
Image, 6.19MB, 5315 × 3543 jpg

Technical Price Graph And Indicator, Red And Green Candlestick Chart On Blue Theme Screen, Market Volatility, Up And Down Trend. Stock Trading, Crypto Currency Background.
Image, 4.09MB, 5472 × 3648 jpg

Indicators Including Volume Analysis For Professional Technical Analysis On The Monitor Of A Computer. Fundamental And Technical Analysis Concept.
Image, 2.75MB, 5315 × 3543 jpg
Downtrend Trend Definition Flat Icon - Bearish Chart Pattern Figure Technical Analysis. Vector Stock And Cryptocurrency Exchange Graph, Forex Analytics, Trading Market Price.
Vector, 0.52MB, 5000 × 3214 eps
Technical Price Graph And Indicator, Red And Green Candlestick Chart On Blue Theme Screen, Market Volatility, Up And Down Trend. Stock Trading, Crypto Currency Background.
Image, 12.74MB, 10039 × 5315 jpg
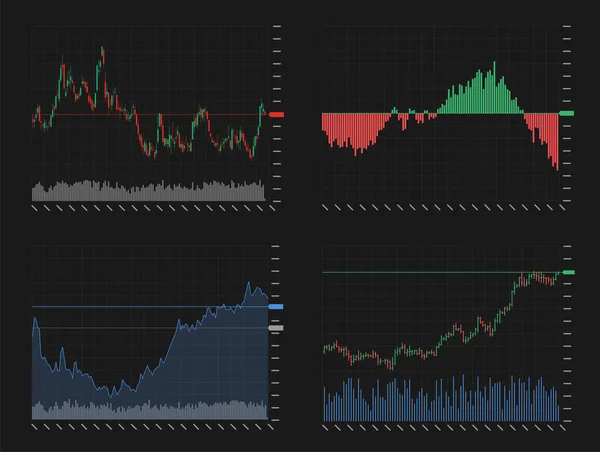
Stock Market Investment Trading Technical Analysis Candlestick, Bar, Line And Area Chart Set. Business Candle Stick Graph Exchange Trend. Trader Financial Investment Index Concept
Vector, 7.48MB, 5301 × 4001 eps

Forex Trading Graph And Candlestick Chart Suitable For Financial Investment Concept. Economy Trends Background For Business Idea And All Art Work Design. Abstract Finance Background.
Image, 20.57MB, 8858 × 4724 jpg
Business Success And Growth Concept.Stock Market Business Graph Chart On Digital Screen.Forex Market, Gold Market And Crude Oil Market .
Image, 4.75MB, 5315 × 3543 jpg

Support And Resistance Level Flat Icon - Price Chart Pattern Figure Technical Analysis. Strong Trend Between Two Parallel Level Line. Stock, Cryptocurrency Graph, Forex Analytics, Trading Market
Vector, 0.53MB, 5000 × 3216 eps

Technical Price Graph And Indicator, Red And Green Candlestick Chart On Blue Theme Screen, Market Volatility, Up And Down Trend. Stock Trading, Crypto Currency Background.
Image, 5.65MB, 5472 × 3648 jpg
Uptrend Trend Definition Flat Icon - Bullish Chart Pattern Figure Technical Analysis. Vector Stock And Cryptocurrency Exchange Graph, Forex Analytics, Trading Market Price.
Vector, 0.52MB, 5000 × 3214 eps

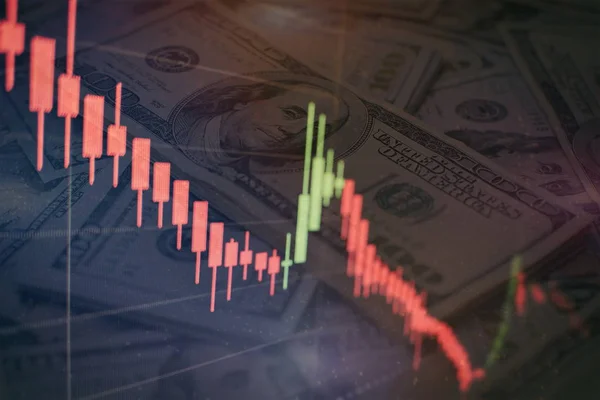
Trading On The Currency Market Forex. Currency Exchange Rate For World Currency: US Dollar, Euro, Frank, Yen. Financial, Money, Global Finance, Stock Market Background
Image, 8.72MB, 5315 × 3543 jpg

Technical Price Graph And Indicator, Red And Green Candlestick Chart On Blue Theme Screen, Market Volatility, Up And Down Trend. Stock Trading, Crypto Currency Background.
Image, 6.1MB, 5315 × 3543 jpg
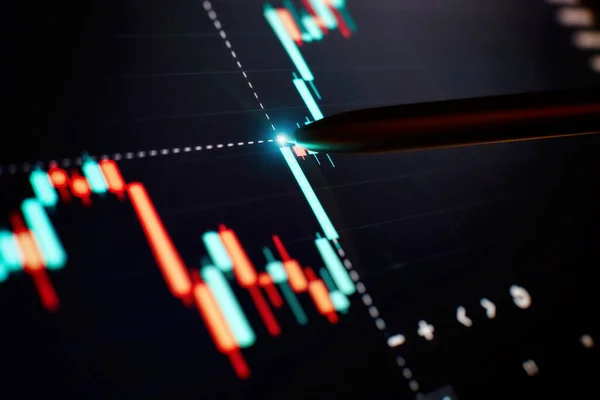
Financial Chart With Pen, Stock Analysis Data For Business Background On Digital Screen. Graphs Of The Growth Of The Financial Market Forex. Trading Candlestick Chart
Image, 2.73MB, 5472 × 3648 jpg
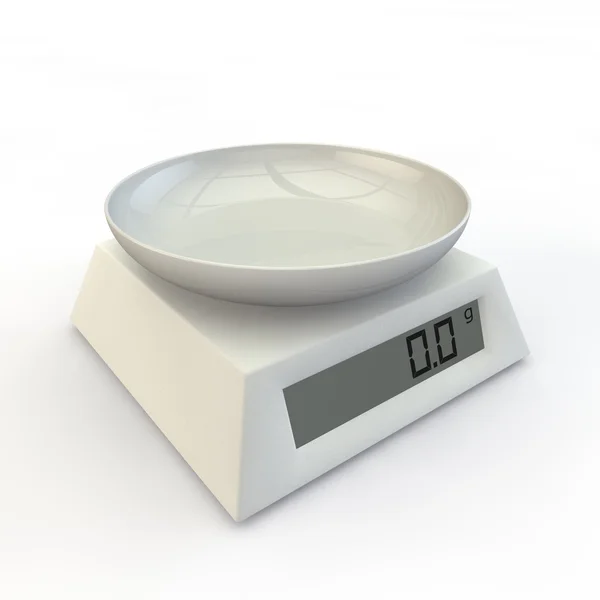
Kitchen Electric Scales Icon. Editable Bold Outline With Color Fill Design. Vector Illustration.
Vector, 2.15MB, 5000 × 5000 eps


MFI Money Flow Index Written On Green Key Of Metallic Keyboard. Finger Pressing Key
Image, 7.55MB, 5242 × 3744 jpg
Laboratory Electronic Oscillator Apparatus And Oscilloscope Measuring Instrument
Image, 5.37MB, 4684 × 1884 jpg

Vector Reaction Diffusion Non-Equilibrium Thermodynamics Design Set - Chemical Kinetics Patterns
Vector, 1.37MB, 4372 × 4301 eps

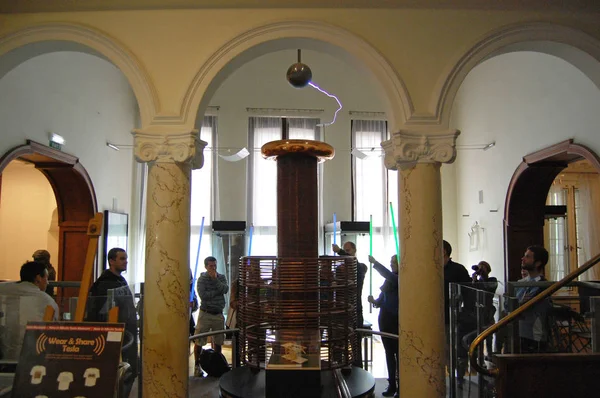
Visitors Are Making An Experiment With The High-frequency Oscillator In The Nikola Tesla Museum In Belgrade, Serbia.
Image, 3.48MB, 3008 × 2000 jpg

Business Success And Growth Concept.Stock Market Business Graph Chart On Digital Screen.Forex Market, Gold Market And Crude Oil Market .
Image, 5.44MB, 5315 × 3543 jpg
Financial Instruments With Various Type Of Indicators Including Volume Analysis For Professional Technical Analysis On The Monitor Of A Computer.
Image, 4.85MB, 8268 × 4724 jpg

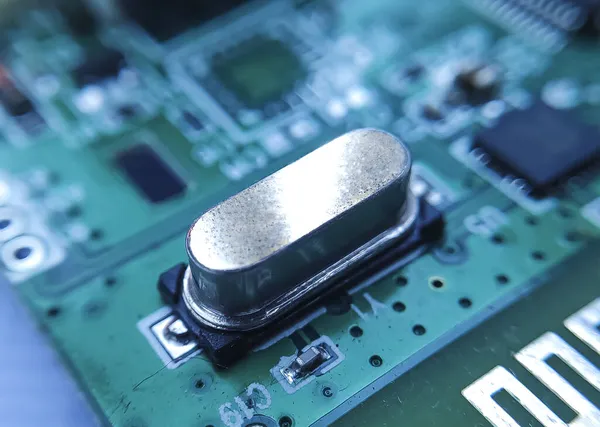
Close Up Image Of Crystal Oscillator Or Electronic Oscillator Circuit. Electronic Component.
Image, 1.41MB, 5190 × 3700 jpg
Previous << Page 3 >> Next