
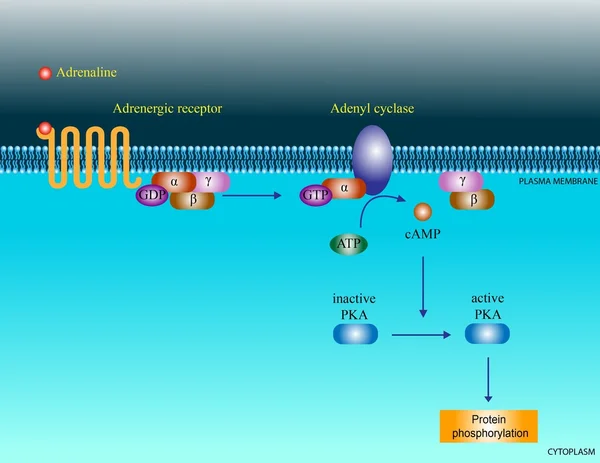
Stock image Phosphorylation
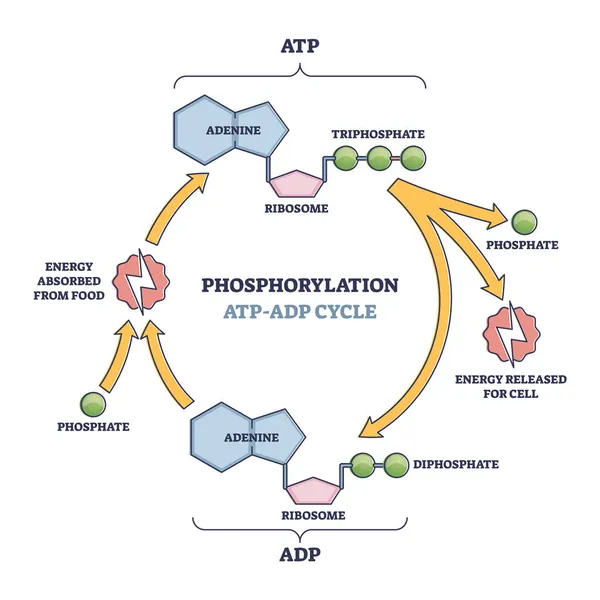
Phosphorylation ATP, ADP Cycle With Detailed Process Stages Outline Diagram
Vector, 5.8MB, 4000 × 4000 eps
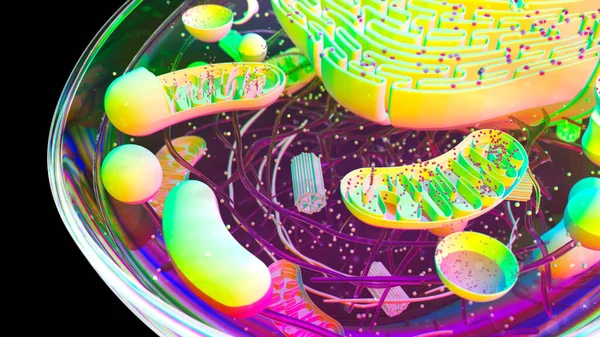
3d Illustration Of The ATP Synthesis In A Mitochondrion. ATP Synthase Couples ATP (red) Synthesis From ADP And Inorganic Phosphate (orange) To A Proton Gradient (light Points) Created Across The Mitochondrial Membrane During Cellular Respiration.
Image, 7.21MB, 8000 × 6000 jpg
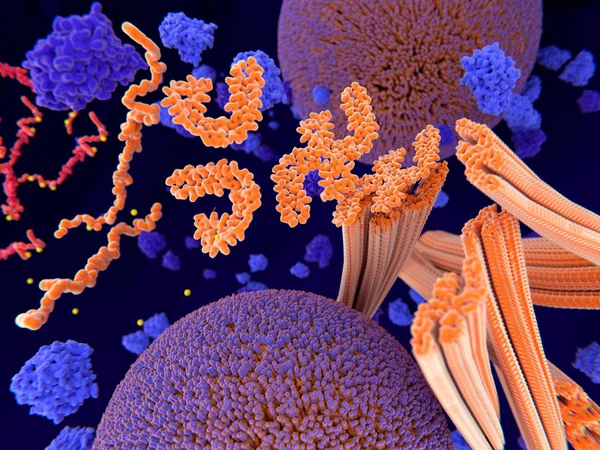
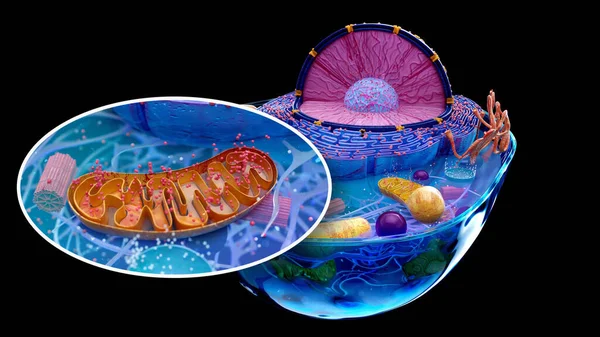
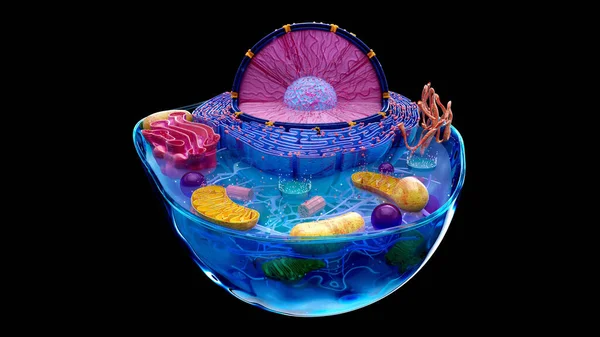
Pathological Phosphorylation (yellow) Of Tau Proteins (red-orange) Leads To Disintegration Of Microtubuli In The Neuron Axon An Aggregation Of The Tau Proteins. The Transport Of Synaptic Vesicles (orange-violet Spheres) Is Interrupted.
Image, 9.48MB, 8000 × 6000 jpg
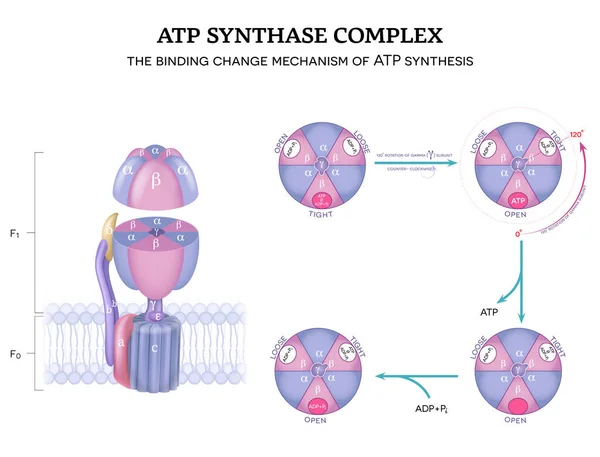
ATP Synthase Complex Structure And Mechanism Of ATP Synthase. The Binding Change Mechanism. 120-degree Rotation Of Gamma Subunit Counter-clockwise.
Vector, 9.35MB, 5512 × 4202 eps
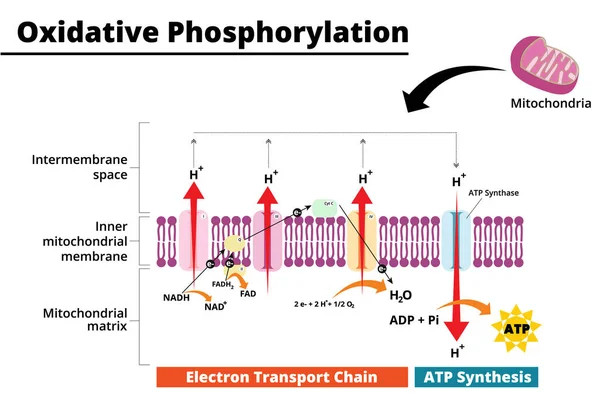
Oxidative Phosphorylation Process. Electron Transport Chain. The Final Step In Cellular Respiration. Vector Illustration. Didatic Illustration.
Vector, 0.73MB, 5000 × 3500 ai


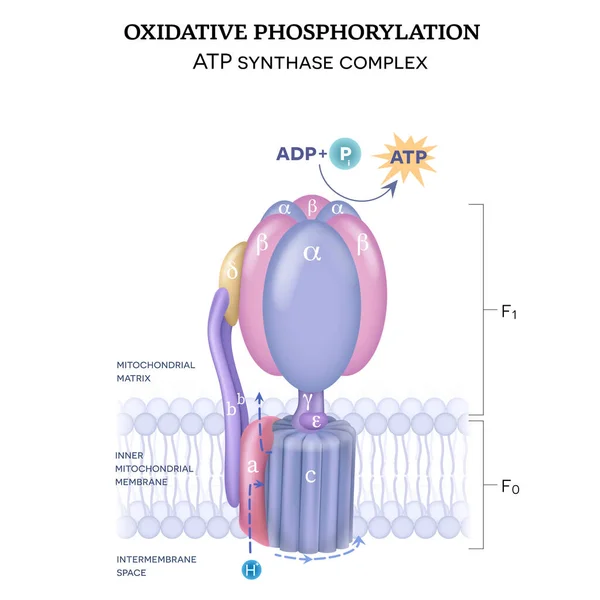
The ATP Synthase Structure (complex V) Consists Of Two Components F0 And F1. The Formation Of ATP Using Adenosine Diphosphate (ADP) And Inorganic Phosphate (Pi)
Vector, 11.37MB, 5000 × 5000 eps


Detailed Citric Acid Cycle Pathway: Vector Illustration For Biochemistry, Molecular Biology, Health Science Education On White Background
Vector, 0.4MB, 5000 × 3000 ai
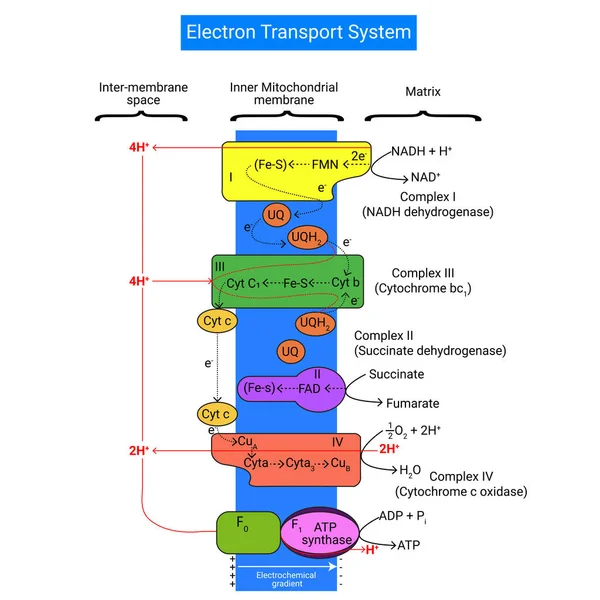
Electron Transport Chain Is A Series Of Compounds Where It Makes Use Of Electrons From Electron Carrier To Develop A Chemical Gradient
Vector, 5.61MB, 10417 × 10417 eps


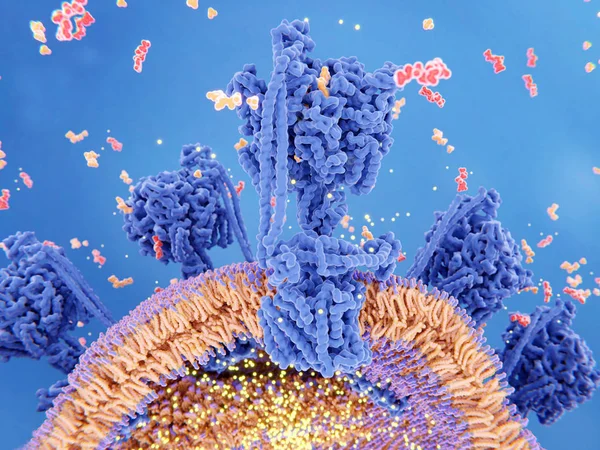
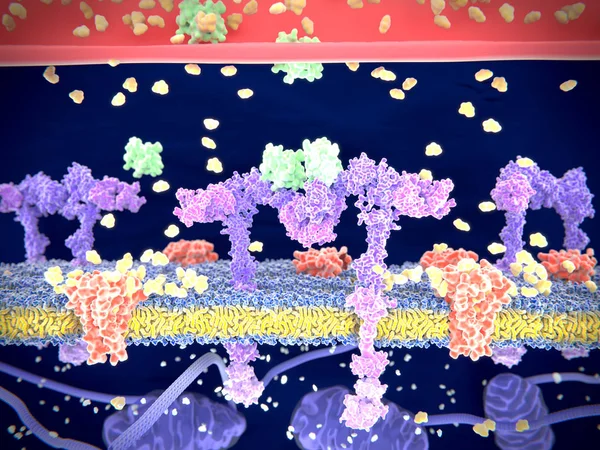
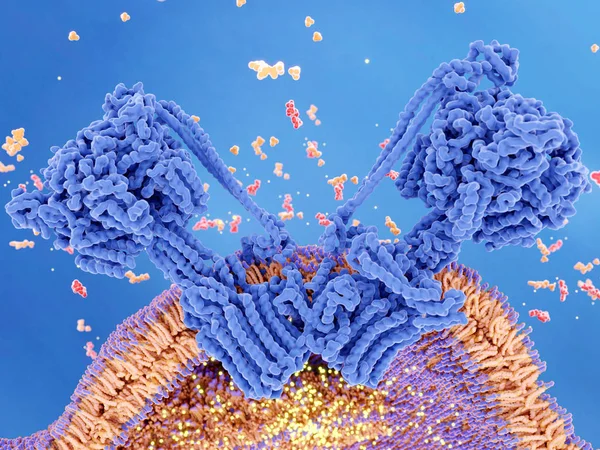
Insulin (green) Binding To The Insulin Receptor (violet) Activates The Transport Of Glucose (yellow) Into The Cell (depicted In 2 Phases) - Illustration
Image, 4.57MB, 4000 × 6200 jpg
Insulin (green) Binding To The Insulin Receptor (violet) Activates The Transport Of Glucose (yellow) Into The Cell. Illustration
Image, 6.21MB, 8000 × 6000 jpg
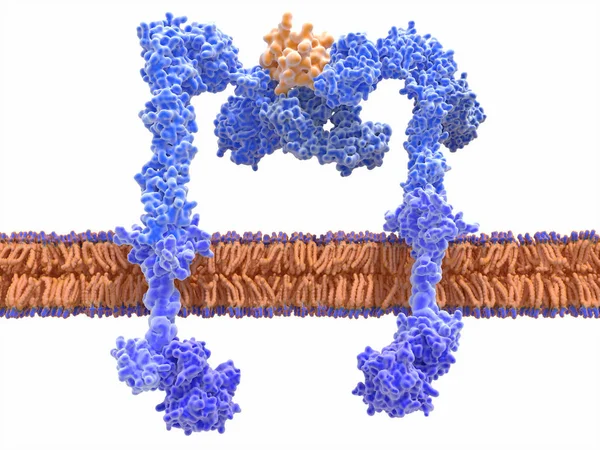
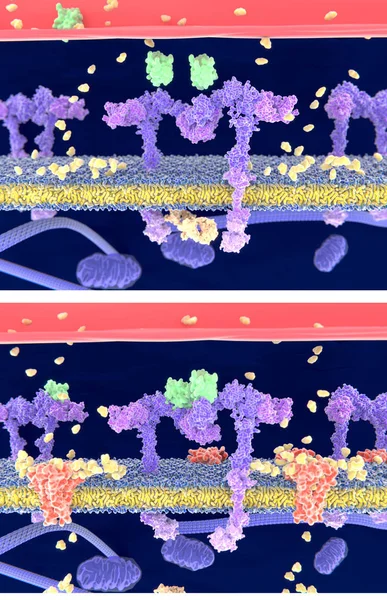
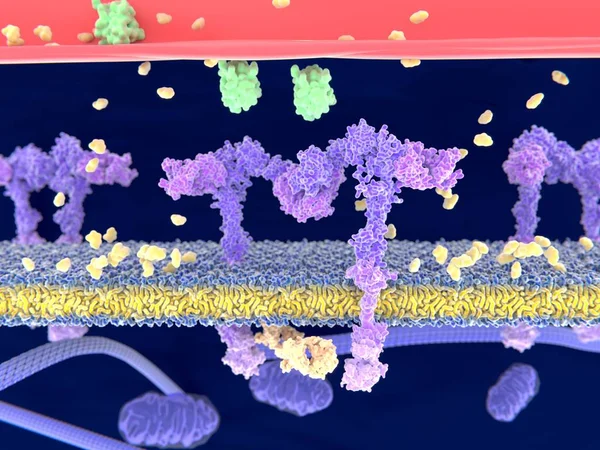
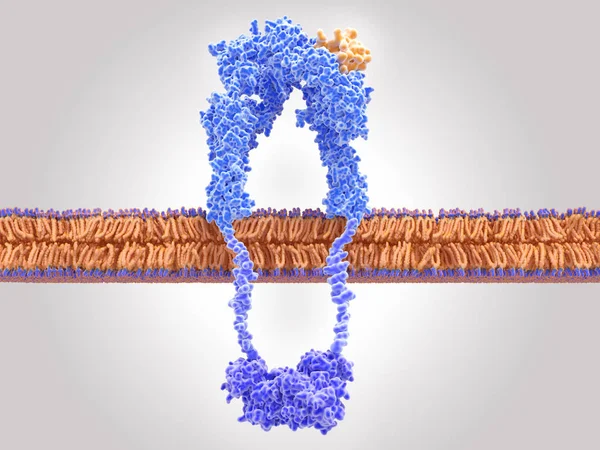
The Insulin Receptor (blue) Is A Transmembrane Protein, That Is Activated By Insulin (orange). Insulin Binding Induces Structural Changes Within The Receptor That Finally Leads To The Activation Of The Glucose Transporter Protein.
Image, 12.2MB, 8000 × 6000 jpg
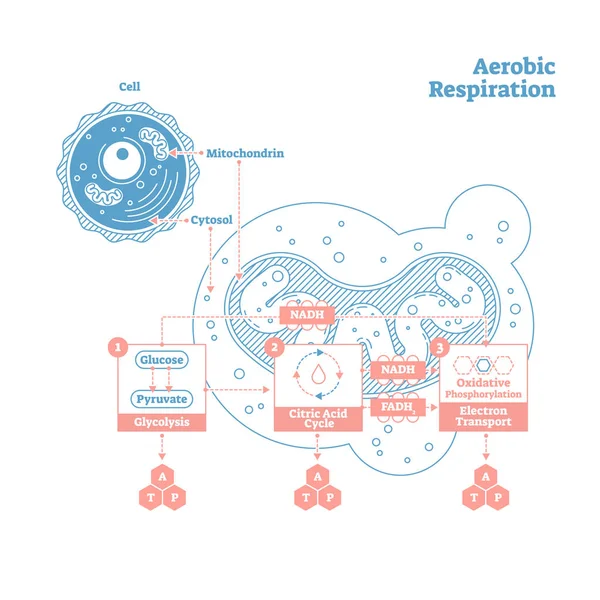
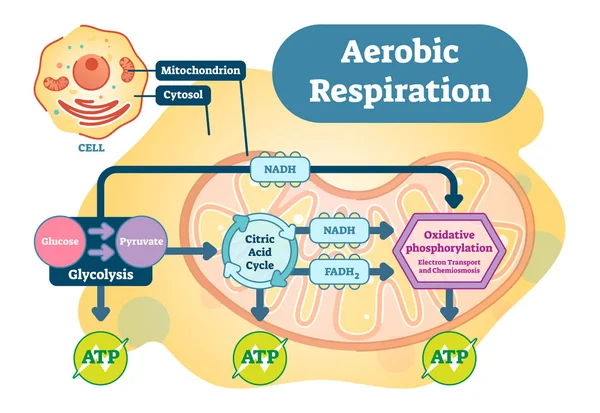
Aerobic Respiration Bio Anatomical Vector Illustration Diagram, Labeled Medical Scheme
Vector, 1.32MB, 5000 × 5000 eps


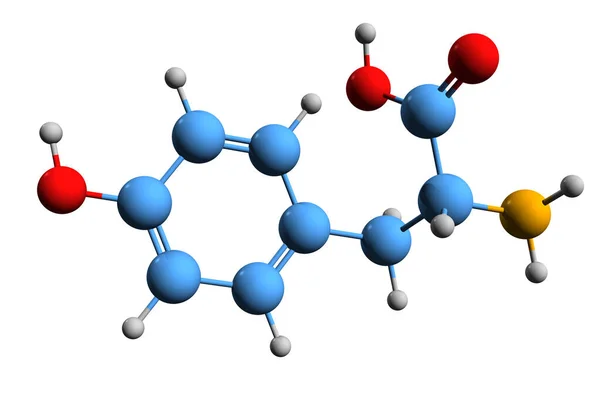
Pyruvic Acid Is The Simplest Of The Alpha-keto Acids, With A Carboxylic Acid And A Ketone Functional Group. 3d Illustration
Image, 0.57MB, 7000 × 3638 jpg
3D Image Of Tyrosine Skeletal Formula - Molecular Chemical Structure Of 4-hydroxyphenylalanine Isolated On White Background
Image, 2.01MB, 5500 × 3630 jpg
ATP Synthase Couples ATP (red) Synthesis From ADP And Inorganic Phosphate (orange) To A Proton Gradient (yellow) Created Across The Mitochondrial Membrane During Cellular Respiration.
Image, 12.41MB, 8000 × 6000 jpg
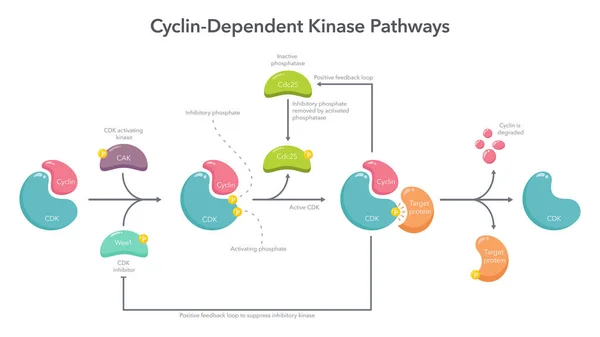
Cyclin Dependent Kinase Activation Pathway Science Vector Illustration Infographic
Vector, 0.45MB, 8333 × 4688 ai


From Bottom To Top: Fo-subunit (violet), Axle-element (light Violet), The Stator Element (light Blue), And ATP Synthesis Takes Place In The Upper F1-subunit (blue).
Image, 2.27MB, 8000 × 6000 jpg
Insulin (green) Binding To The Insulin Receptor (violet) Activates The Transport Of Glucose (yellow) Into The Cell. Illustration
Image, 3.71MB, 8000 × 6000 jpg
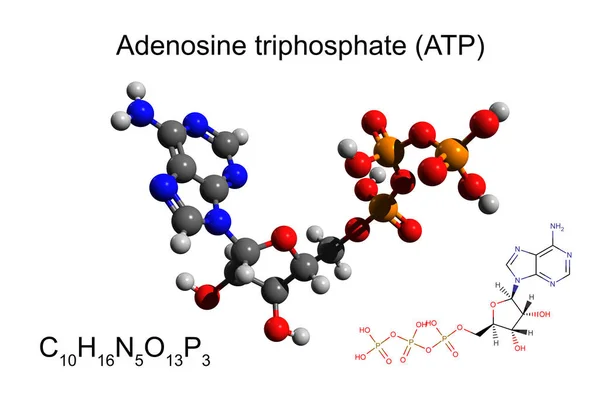
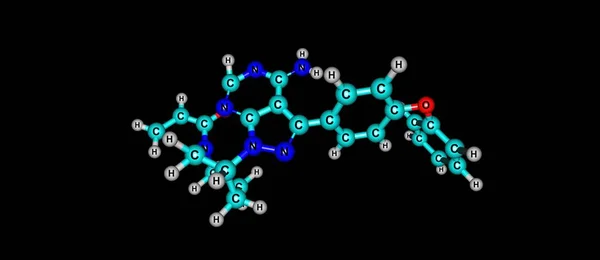
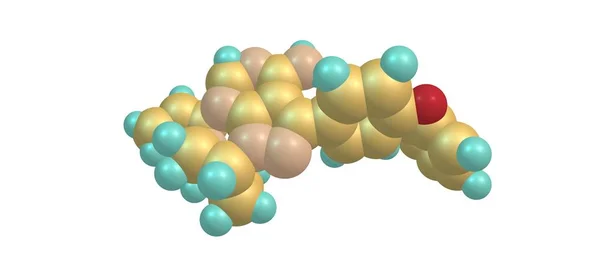
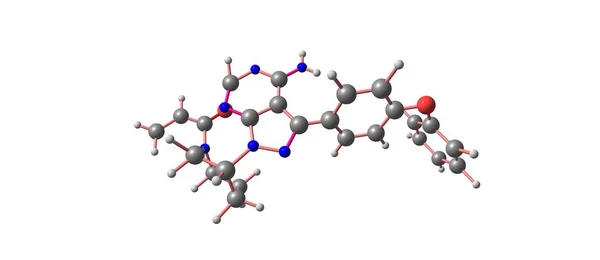
Chemical Formula, Skeletal Formula And 3D Ball-and-stick Model Of Adenosine Triphosphate (ATP), White Background
Image, 1.53MB, 6500 × 4500 jpg

Insulin (green) Binding To The Insulin Receptor (violet) Activates The Transport Of Glucose (yellow) Into The Cell (phase 1). Illustration
Image, 3.96MB, 8000 × 6000 jpg


An Electron Transport Chain. Oxidative Phosphorylation, The Final Stage Of Cellular Respiration. It Occurs In The Inner Mitochondrial Membrane In Eukaryotes
Vector, 8.96MB, 6200 × 3734 eps
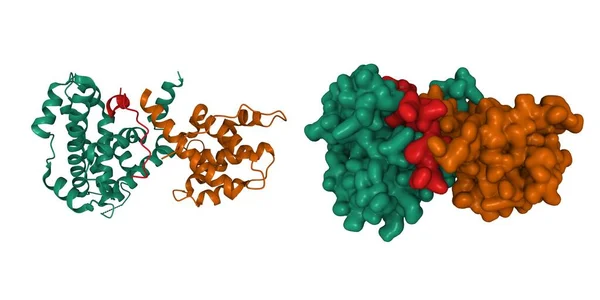
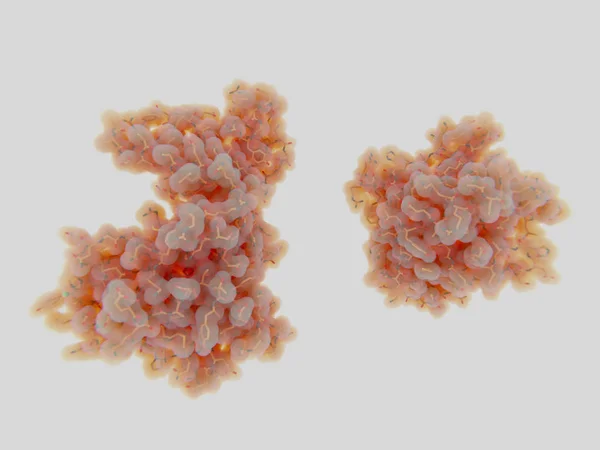
Crystal Structure Of The Retinoblastoma Tumor Suppressor Protein (AB Domain, Green And Brown) Bound To E2F Peptide (red), 3D Cartoon And Gaussian Surface Models, Chain Id Color Scheme, PDB 1o9k
Image, 3.72MB, 8000 × 4000 jpg
Page 1 >> Next