
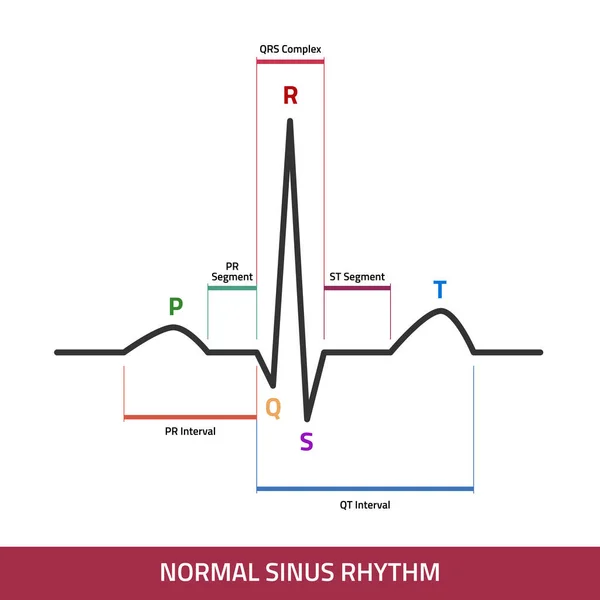
Stock image Qt Interval
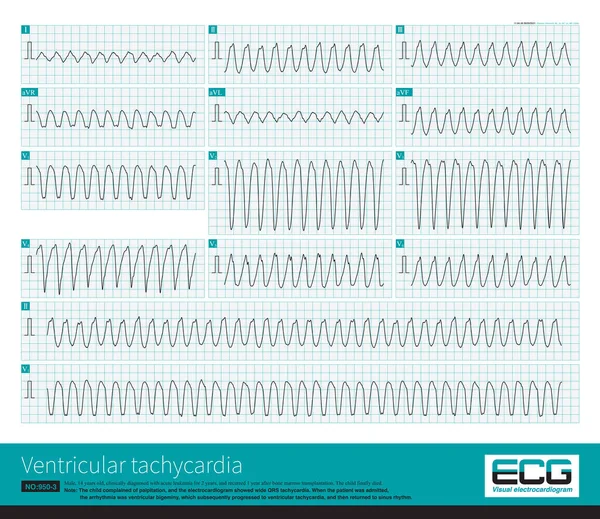
A 14-year-old Leukemic Child Had A Sudden Wide QRS Tachycardia With A Frequency Of 167 Bpm, And The Rhythm Was Regular. After Anti-arrhythmia Treatment, The Patient Recovered To Sinus Rhythm.
Image, 32.12MB, 10000 × 8649 jpg

The QT Interval Of ECG Is From The Beginning Of QRS Wave To The End Of T Wave, Representing The Total Time Of Ventricular Depolarization And Repolarization.
Image, 8.09MB, 10000 × 10950 jpg
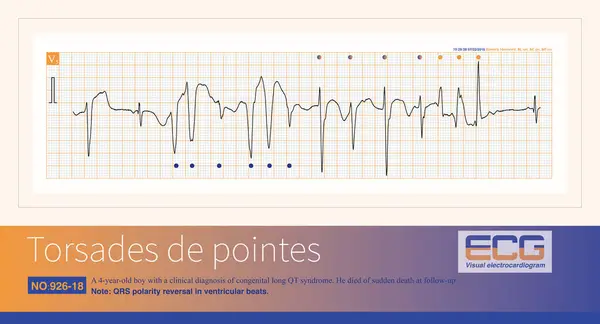
A 4-year-old Boy With A Clinical Diagnosis Of Long QT Syndrome. No Genetic Testing Was Done During Hospitalization. The Child Died Suddenly During Follow-up.
Image, 7.66MB, 10000 × 5414 jpg
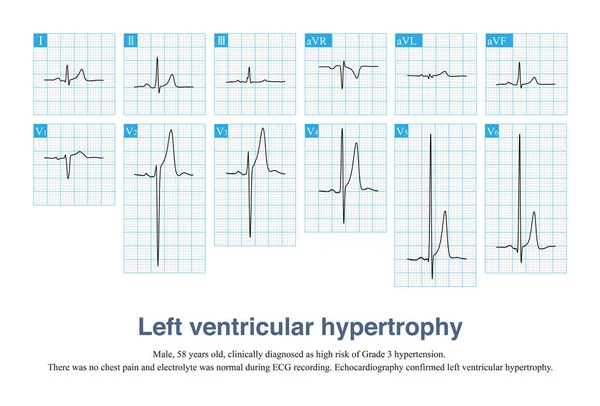
Sometimes, Left Ventricular Hypertrophy With Tall T Waves Is Easily Misdiagnosed As Hyperkalemia And Hyperacute T Waves, And ECG Needs To Be Carefully Identified In Combination With Clinic.
Image, 13.77MB, 10000 × 6782 jpg

Torsade De Pointes Refers To The Pleomorphic Ventricular Tachycardia That Occurs In The Background Of Long QT Interval, And The Polarity Of QRS Wave Twists Around The Equipotential Line.
Image, 18.28MB, 10000 × 5808 jpg
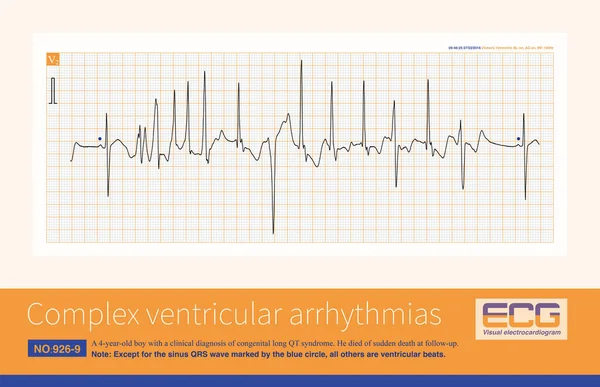
A 4-year-old Boy With A Clinical Diagnosis Of Long QT Syndrome. No Genetic Testing Was Done During Hospitalization. The Child Died Suddenly During Follow-up.
Image, 14.4MB, 10000 × 6468 jpg
EKG Showing Normal Heartbeat Wave. ECG Of Normal Sinus Rhythm Infographic Diagram.
Vector, 0.61MB, 5000 × 5000 eps

R Wave Greater Than S Wave Is Judged To Be Positive; R Smaller Than S Is Judged To Be Negative; R Equal To S Amplitude Is Judged To Be Equipotential.
Image, 7.5MB, 10000 × 5119 jpg

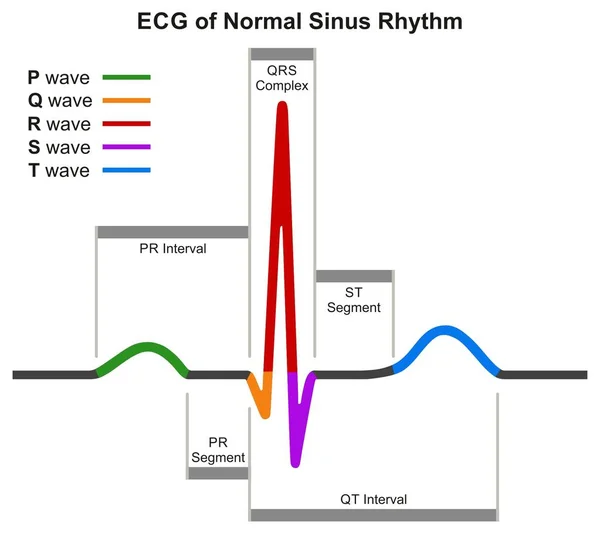
ECG Of Normal Sinus Rhythm Infographic Diagram Showing Normal Heart Beat Wave Including Intervals Segments And Complex For Medical Science Education And Health Care
Vector, 0.15MB, 2169 × 1933 eps
3D Illustration Of An Electrocardiogram (ECG) Showing Prolonged QT Interval With Broad-based T-waves, Characteristic Of Type 1 Long QT Syndrome.
Image, 1.22MB, 9000 × 4000 jpg

Long QT Syndrome, Type 2. 3D Illustration Of An Electrocardiogram (ECG) Showing Prolonged QT Interval With Notched And Of Lower Amplitude T-waves.
Image, 0.98MB, 7000 × 3647 jpg

Long QT Syndrome, Type 2. 3D Illustration Of An Electrocardiogram (ECG) Showing Prolonged QT Interval With Notched And Of Lower Amplitude T-waves.
Image, 1.09MB, 9000 × 4000 jpg

Long QT Syndrome, Type 2. 3D Illustration Of An Electrocardiogram (ECG) Showing Prolonged QT Interval With Notched And Of Lower Amplitude T-waves.
Image, 0.88MB, 9000 × 4000 jpg

Long QT Syndrome, Type 2. 3D Illustration Of An Electrocardiogram (ECG) Showing Prolonged QT Interval With Notched And Of Lower Amplitude T-waves.
Image, 3.79MB, 9000 × 4000 jpg

Long QT Syndrome, Type 2. 3D Illustration Of An Electrocardiogram (ECG) Showing Prolonged QT Interval With Notched And Of Lower Amplitude T-waves.
Image, 0.64MB, 7000 × 2867 jpg

Long QT Syndrome, Type 2. 3D Illustration Of An Electrocardiogram (ECG) Showing Prolonged QT Interval With Notched And Of Lower Amplitude T-waves.
Image, 5.51MB, 9000 × 4000 jpg

Long QT Syndrome, Type 2. 3D Illustration Of An Electrocardiogram (ECG) Showing Prolonged QT Interval With Notched And Of Lower Amplitude T-waves.
Image, 0.64MB, 7000 × 2867 jpg

Long QT Syndrome, Type 2. 3D Illustration Of An Electrocardiogram (ECG) Showing Prolonged QT Interval With Notched And Of Lower Amplitude T-waves.
Image, 7.28MB, 8000 × 4000 jpg

3D Illustration Of An Electrocardiogram (ECG) Showing Prolonged QT Interval With Broad-based T-waves, Characteristic Of Type 1 Long QT Syndrome.
Image, 0.96MB, 9000 × 4000 jpg

3D Illustration Of An Electrocardiogram (ECG) Showing Prolonged QT Interval With Broad-based T-waves, Characteristic Of Type 1 Long QT Syndrome.
Image, 0.71MB, 7000 × 2926 jpg

3D Illustration Of An Electrocardiogram (ECG) Showing Prolonged QT Interval With Broad-based T-waves, Characteristic Of Type 1 Long QT Syndrome.
Image, 5.58MB, 7000 × 3938 jpg


3D Illustration Of An Electrocardiogram (ECG) Showing Prolonged QT Interval With Broad-based T-waves, Characteristic Of Type 1 Long QT Syndrome.
Image, 0.71MB, 7000 × 2926 jpg

3D Illustration Of An Electrocardiogram (ECG) Showing Prolonged QT Interval With Broad-based T-waves, Characteristic Of Type 1 Long QT Syndrome.
Image, 1MB, 7000 × 3646 jpg

3D Illustration Of An Electrocardiogram (ECG) Showing Prolonged QT Interval With Broad-based T-waves, Characteristic Of Type 1 Long QT Syndrome.
Image, 5.18MB, 9000 × 4000 jpg

3D Illustration Of An Electrocardiogram (ECG) Showing Prolonged QT Interval With Broad-based T-waves, Characteristic Of Type 1 Long QT Syndrome.
Image, 5.55MB, 9000 × 4000 jpg

3D Illustration Of An Electrocardiogram (ECG) Showing Prolonged QT Interval With Broad-based T-waves, Characteristic Of Type 1 Long QT Syndrome.
Image, 1.31MB, 8000 × 4000 jpg

Long QT Syndrome, Type 2. 3D Illustration Of An Electrocardiogram (ECG) Showing Prolonged QT Interval With Notched And Of Lower Amplitude T-waves.
Image, 1.24MB, 8000 × 4000 jpg

Long QT Syndrome, Type 2. 3D Illustration Of An Electrocardiogram (ECG) Showing Prolonged QT Interval With Notched And Of Lower Amplitude T-waves.
Image, 0.95MB, 9000 × 4000 jpg

3D Illustration Of An Electrocardiogram (ECG) Showing Prolonged QT Interval With Broad-based T-waves, Characteristic Of Type 1 Long QT Syndrome.
Image, 3.59MB, 8000 × 4000 jpg

Long QT Syndrome, Type 2. 3D Illustration Of An Electrocardiogram (ECG) Showing Prolonged QT Interval With Notched And Of Lower Amplitude T-waves.
Image, 5.18MB, 7000 × 3647 jpg

Long QT Syndrome, Type 2. 3D Illustration Of An Electrocardiogram (ECG) Showing Prolonged QT Interval With Notched And Of Lower Amplitude T-waves.
Image, 5.11MB, 9000 × 4000 jpg

Sotalol Drug Molecule. Used To Treat And Prevent Abnormal Heart Rhythms. Molecular Model. 3D Rendering. Illustration
Image, 5.41MB, 8700 × 4260 jpg

Long QT Syndrome, Type 2. 3D Illustration Of An Electrocardiogram (ECG) Showing Prolonged QT Interval With Notched And Of Lower Amplitude T-waves.
Image, 3.89MB, 7000 × 2891 jpg

Bidirectional Ventricular Tachycardia Is A Kind Of Malignant Arrhythmia. The Polarity Of QRS Main Wave Alternates From Beat To Beat, And It Is Easy To Degenerate Into Ventricular Fibrillation.
Image, 10.66MB, 10000 × 4450 jpg

3D Illustration Of An Electrocardiogram (ECG) Showing Prolonged QT Interval With Broad-based T-waves, Characteristic Of Type 1 Long QT Syndrome.
Image, 2.83MB, 7000 × 3500 jpg

Long QT Syndrome, Type 2. 3D Illustration Of An Electrocardiogram (ECG) Showing Prolonged QT Interval With Notched And Of Lower Amplitude T-waves.
Image, 2.79MB, 7000 × 3647 jpg

Long QT Syndrome, Type 2. 3D Illustration Of An Electrocardiogram (ECG) Showing Prolonged QT Interval With Notched And Of Lower Amplitude T-waves.
Image, 5.22MB, 9000 × 4000 jpg

Long QT Syndrome, Type 2. 3D Illustration Of An Electrocardiogram (ECG) Showing Prolonged QT Interval With Notched And Of Lower Amplitude T-waves.
Image, 1.97MB, 9000 × 4000 jpg

3D Illustration Of An Electrocardiogram (ECG) Showing Prolonged QT Interval With Broad-based T-waves, Characteristic Of Type 1 Long QT Syndrome.
Image, 1.13MB, 9000 × 4000 jpg

Long QT Syndrome, Type 2. 3D Illustration Of An Electrocardiogram (ECG) Showing Prolonged QT Interval With Notched And Of Lower Amplitude T-waves.
Image, 1.17MB, 9000 × 4000 jpg

3D Illustration Of An Electrocardiogram (ECG) Showing Prolonged QT Interval With Broad-based T-waves, Characteristic Of Type 1 Long QT Syndrome.
Image, 0.96MB, 9000 × 4000 jpg

3D Illustration Of An Electrocardiogram (ECG) Showing Prolonged QT Interval With Broad-based T-waves, Characteristic Of Type 1 Long QT Syndrome.
Image, 3.59MB, 8000 × 4000 jpg

3D Illustration Of An Electrocardiogram (ECG) Showing Prolonged QT Interval With Broad-based T-waves, Characteristic Of Type 1 Long QT Syndrome.
Image, 1.03MB, 9000 × 4000 jpg

Long QT Syndrome, Type 2. 3D Illustration Of An Electrocardiogram (ECG) Showing Prolonged QT Interval With Notched And Of Lower Amplitude T-waves.
Image, 2.79MB, 7000 × 3647 jpg

3D Illustration Of An Electrocardiogram (ECG) Showing Prolonged QT Interval With Broad-based T-waves, Characteristic Of Type 1 Long QT Syndrome.
Image, 3.84MB, 9000 × 4000 jpg

Long QT Syndrome, Type 2. 3D Illustration Of An Electrocardiogram (ECG) Showing Prolonged QT Interval With Notched And Of Lower Amplitude T-waves.
Image, 7.28MB, 8000 × 4000 jpg

3D Illustration Of An Electrocardiogram (ECG) Showing Prolonged QT Interval With Broad-based T-waves, Characteristic Of Type 1 Long QT Syndrome.
Image, 5.55MB, 9000 × 4000 jpg
Page 1 >> Next