Stock image 3D illustration visualizing an ECG with 3rd degree AV block, showing complete dissociation between atrial and ventricular rhythms.

Published: Jun.26, 2024 08:50:55
Author: katerynakon
Views: 0
Downloads: 0
File type: image / jpg
File size: 7.45 MB
Orginal size: 9000 x 6000 px
Available sizes:
Level: silver
Similar stock images
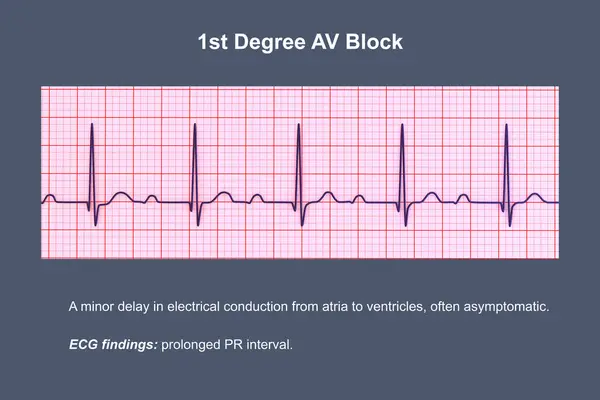
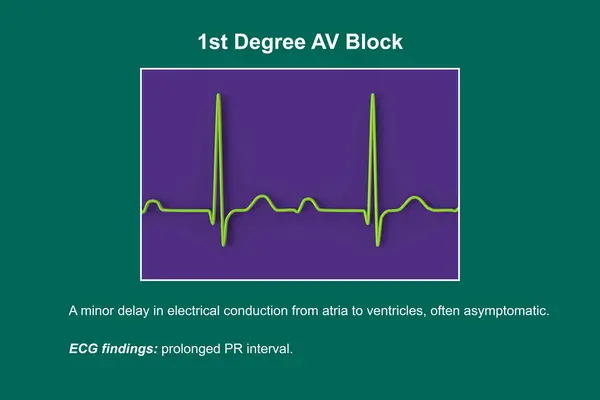
3D Illustration Of An ECG Displaying 1st Degree AV Block, A Cardiac Conduction Disorder.
9000 × 6000

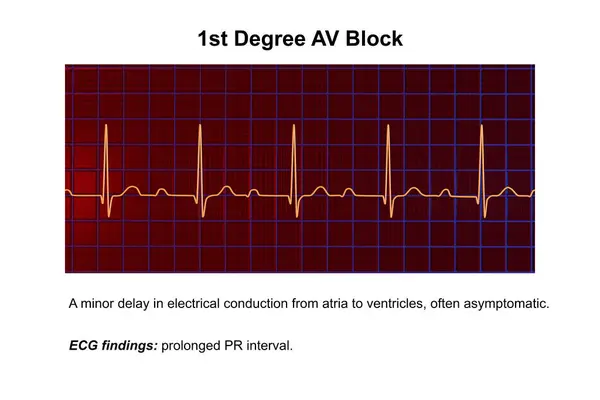
3D Illustration Of An ECG Displaying 1st Degree AV Block, A Cardiac Conduction Disorder.
9000 × 6000
3D Illustration Of An ECG Displaying 1st Degree AV Block, A Cardiac Conduction Disorder.
9000 × 6000

3D Illustration Of An ECG Displaying 1st Degree AV Block, A Cardiac Conduction Disorder.
9000 × 6000
3D Illustration Of An ECG Displaying 1st Degree AV Block, A Cardiac Conduction Disorder.
9000 × 6000