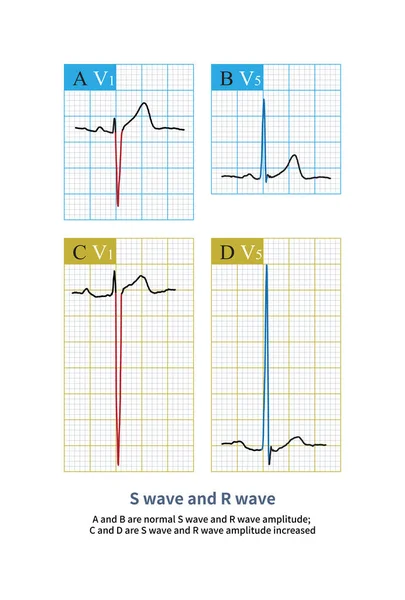
Stock image A and B are the normal S wave and R wave amplitude; C and D are the S wave and R wave of a case of left ventricular hypertrophy with a significant increase in amplitude.
Published: May.10, 2023 13:09:12
Author: asia11m
Views: 25
Downloads: 0
File type: image / jpg
File size: 8.98 MB
Orginal size: 10000 x 14790 px
Available sizes:
Level: beginner