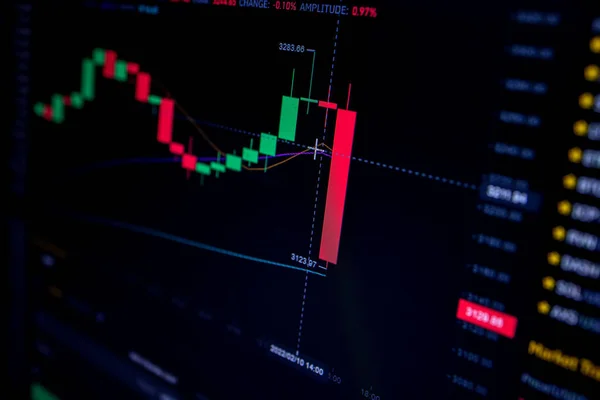
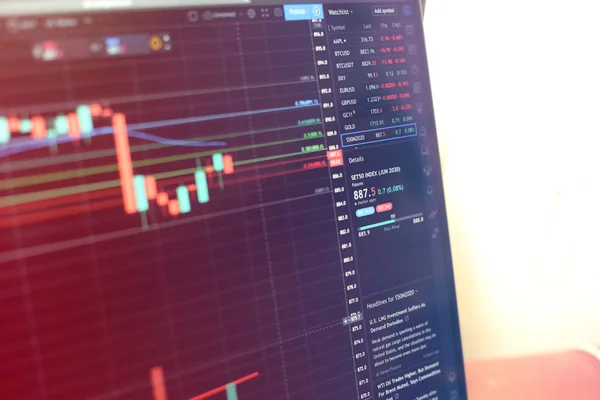
Stock image Laptop screen with stock market charts. Technical analysis and fundamental indicators of stock quotes in the trading terminal. Japanese candlesticks and company tickers.

Published: Jan.11, 2022 10:38:14
Author: Ufalab
Views: 21
Downloads: 2
File type: image / jpg
File size: 10.32 MB
Orginal size: 6384 x 3776 px
Available sizes:
Level: bronze